Ask Your Question
0

IO Graph: Plot ICMP response time

asked 2018-01-16 23:32:59 +0000

praneet.castelino gravatar image

updated 2018-01-17 03:00:58 +0000

Guy Harris gravatar image

I have captured ICMP replies and responses, I have set it up so as to display the response time as a column. What I want to know is if it is possible to plot this ICMP response time on IO graph as line.

Can someone give me some hints or tips on doing this. I am using version 2.4.4.

edit retag flag offensive close merge delete

1 Answer

Sort by ยป oldest newest most voted
1

answered 2018-01-17 07:32:18 +0000

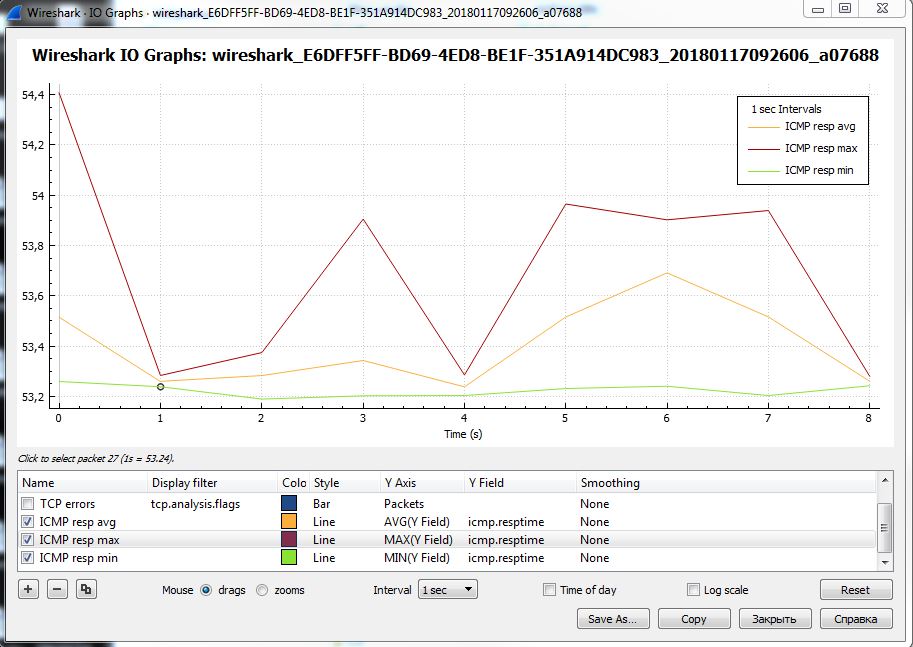
Yes, you can create plot like below on the picture.

Use MIN/AVG/MAX as Y axis and icmp.resptime as Y field.

image description

edit flag offensive delete link more

Comments

Wow, that was straightforward. Thank you so much.

praneet.castelino gravatar imagepraneet.castelino ( 2018-01-18 02:22:08 +0000 )edit

Your Answer

Please start posting anonymously - your entry will be published after you log in or create a new account.

Add Answer

Question Tools

1 follower

Stats

Asked: 2018-01-16 23:32:59 +0000

Seen: 6,467 times

Last updated: Jan 17 '18