answered 2018-01-17 07:32:18 +0000
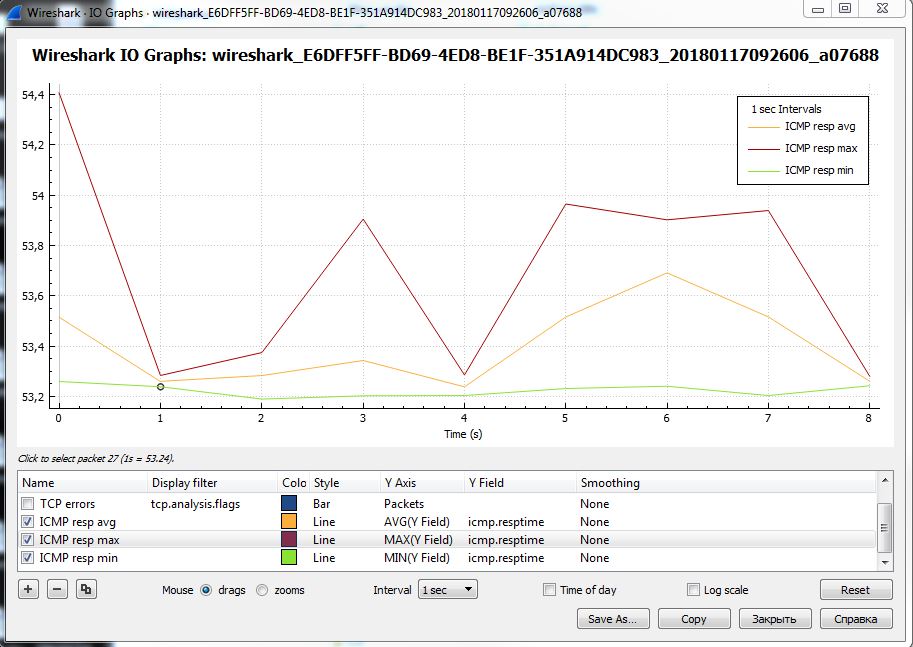
Yes, you can create plot like below on the picture.
Use MIN/AVG/MAX as Y axis and icmp.resptime as Y field.