Ask Your Question
0

tcptrace graphic analysis

asked 2025-08-28 14:44:45 +0000

rmdck gravatar image

updated 2025-08-28 14:46:48 +0000

Hello,

I am working on the http-download-bad.pcapng from wireshark (uploaded here in order to udnerstand tcptrace graphic. The graph is made from 61.8.0.17:80 -> 10.0.52.164.2250

From packet 133, we have packet loss and from pkt 135 in the graph there is a vertical red line under the "I". This line grows up until packet 163 and then, a brown line appears in the graph and the red line is reduced. From my understanding brown lines are sack block form the tcp receiver whereas red lines are duplicate ack from the sender. But the graph does not reflect it. I probably misunderstood something. Can you clarify me the graph? Thanks

edit retag flag offensive close merge delete

Comments

Wireshark version, there have been changes in this area over the years?

grahamb gravatar imagegrahamb ( 2025-08-28 14:50:36 +0000 )edit

version: 3.6.2 (Git v3.6.2 packaged as 3.6.2-2) Linux.

rmdck gravatar imagermdck ( 2025-08-28 14:58:47 +0000 )edit

1 Answer

Sort by ยป oldest newest most voted
0

answered 2025-08-30 07:35:27 +0000

SYN-bit gravatar image

The brown line represents the (cumulative) ACK from the receiver side. The red lines represent the SACK blocks in the DUP-ACKs.

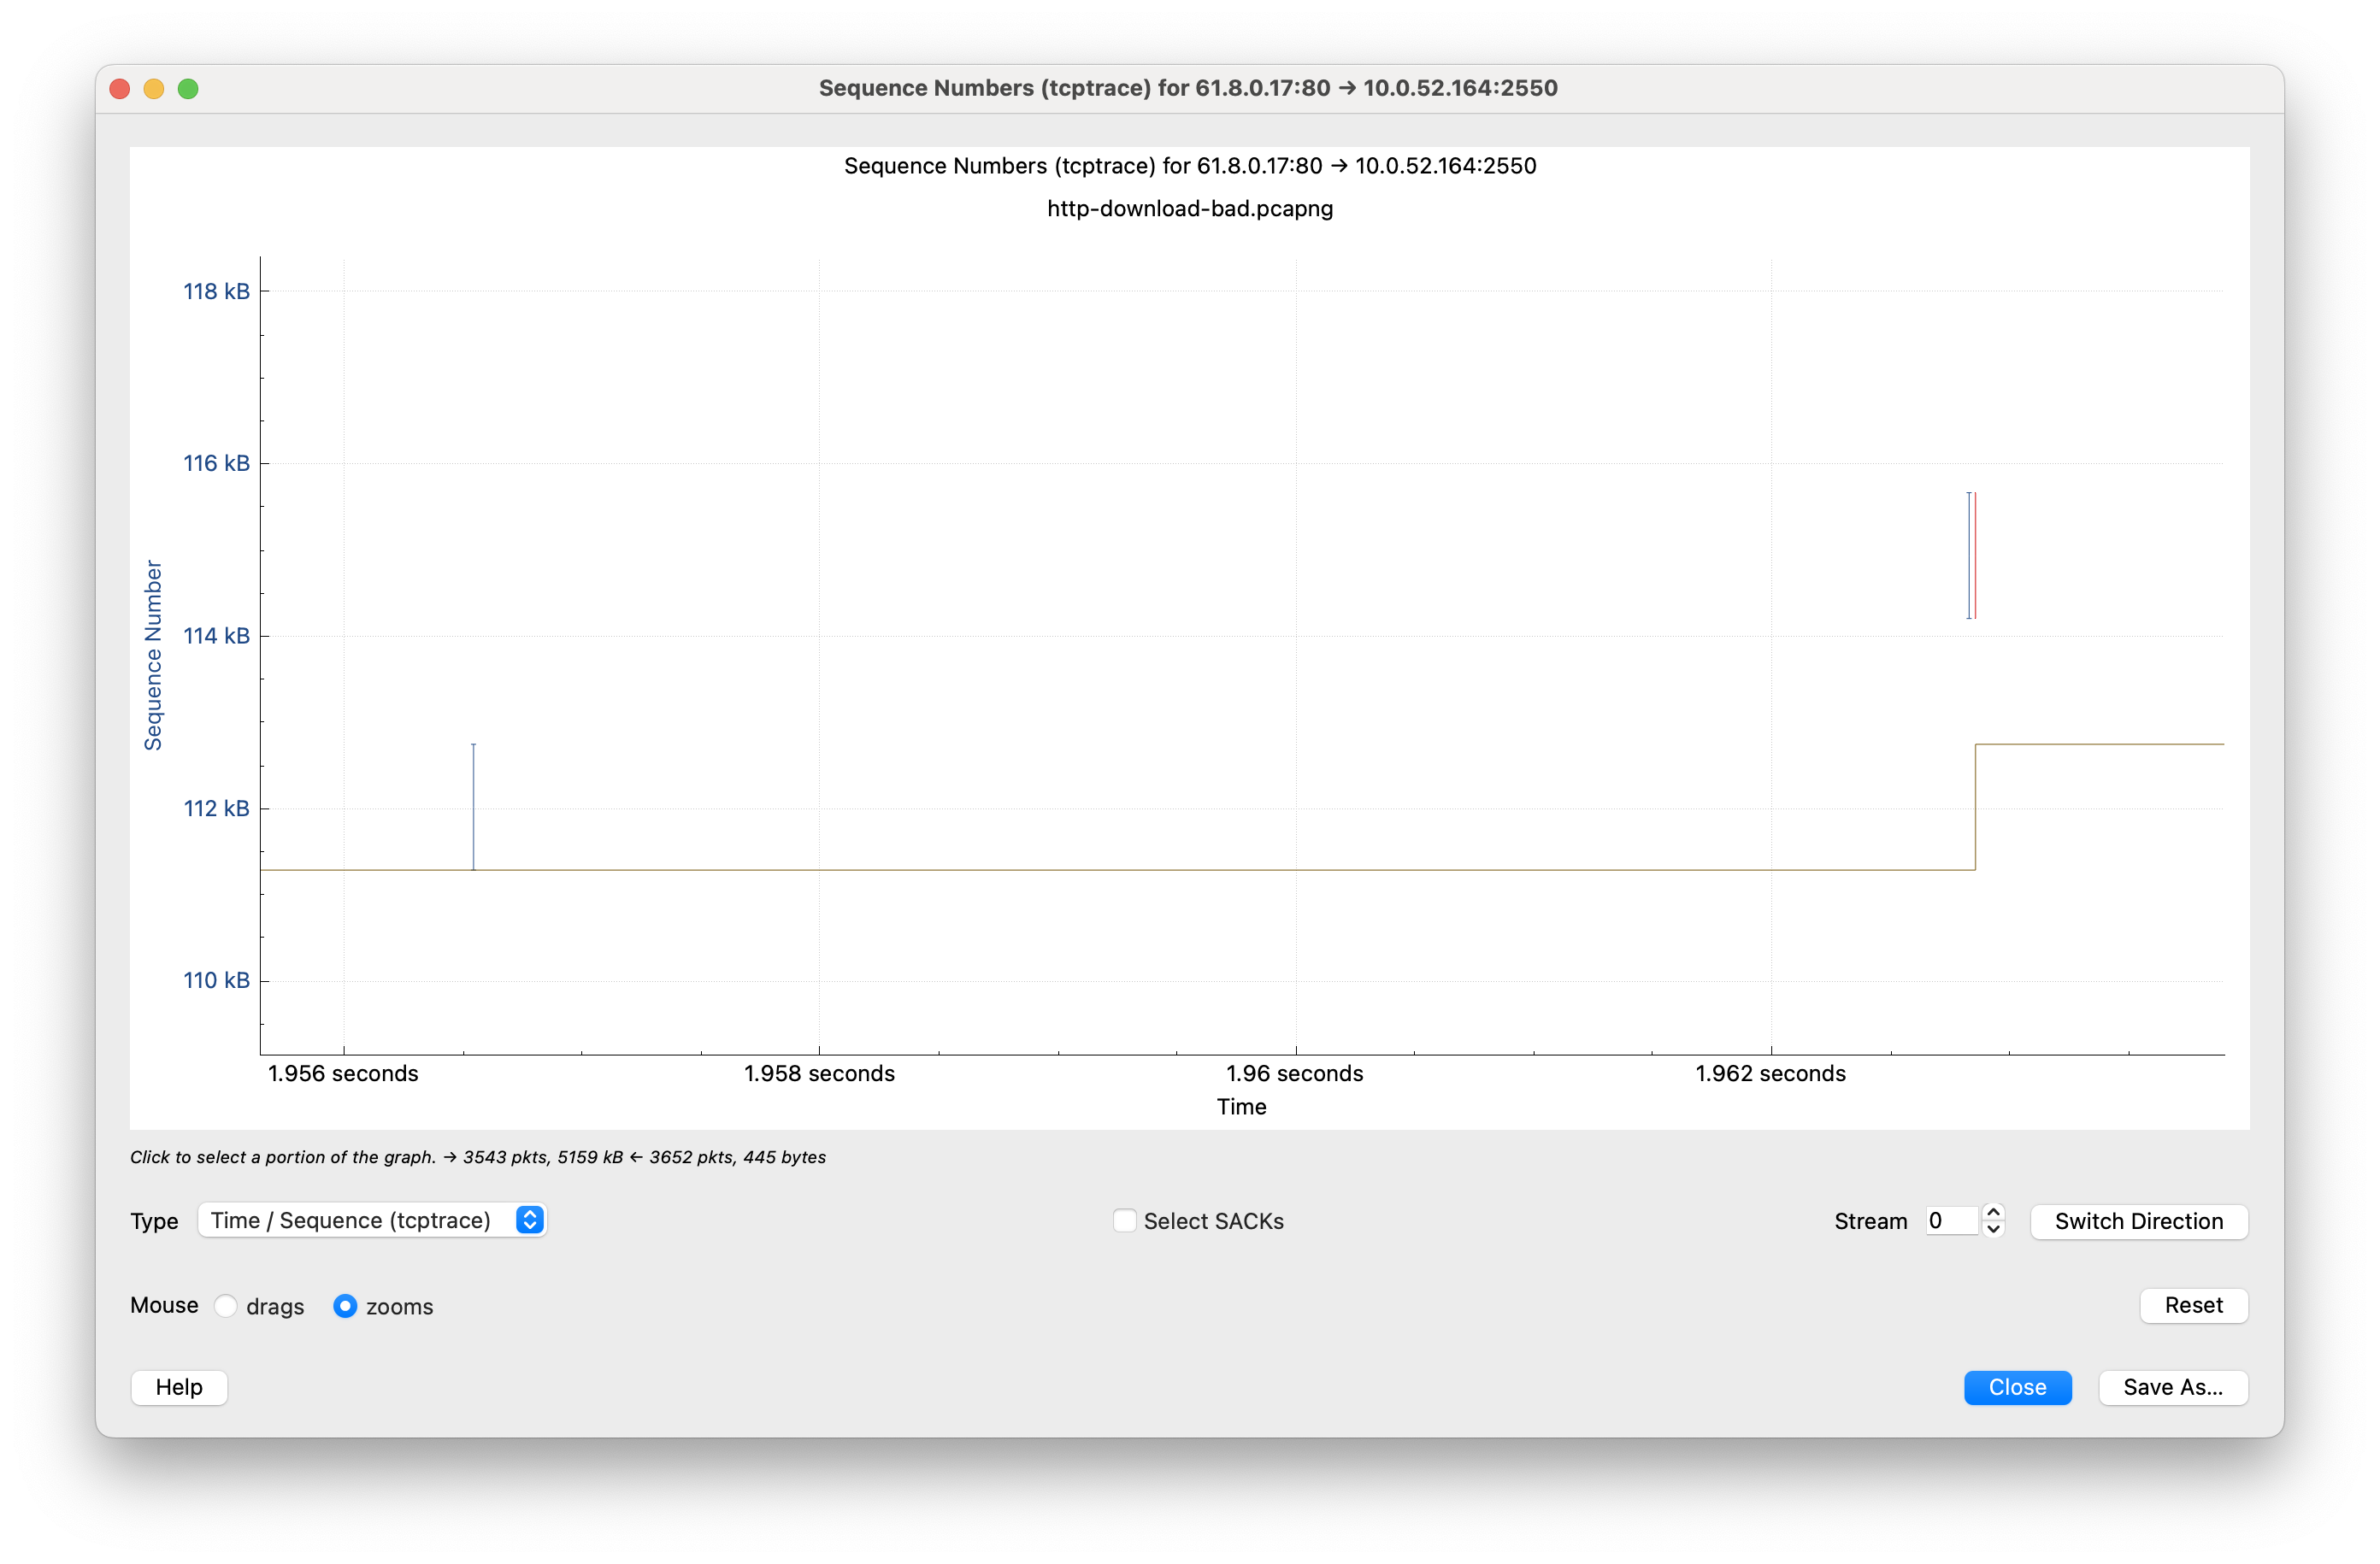
When frame 132 and 133 are received, there is a missing segment in between. This generated a DUP-ACK where the cumulative ACK (brown line at the bottom) is raised to ACK the reception of the data segment in frame 132. But sinde there is data missing in between, the data segment in frame 133 is SACKed which is visible in the red line. The gap between the brown line and the bottom of the red line is the missing data:

image description

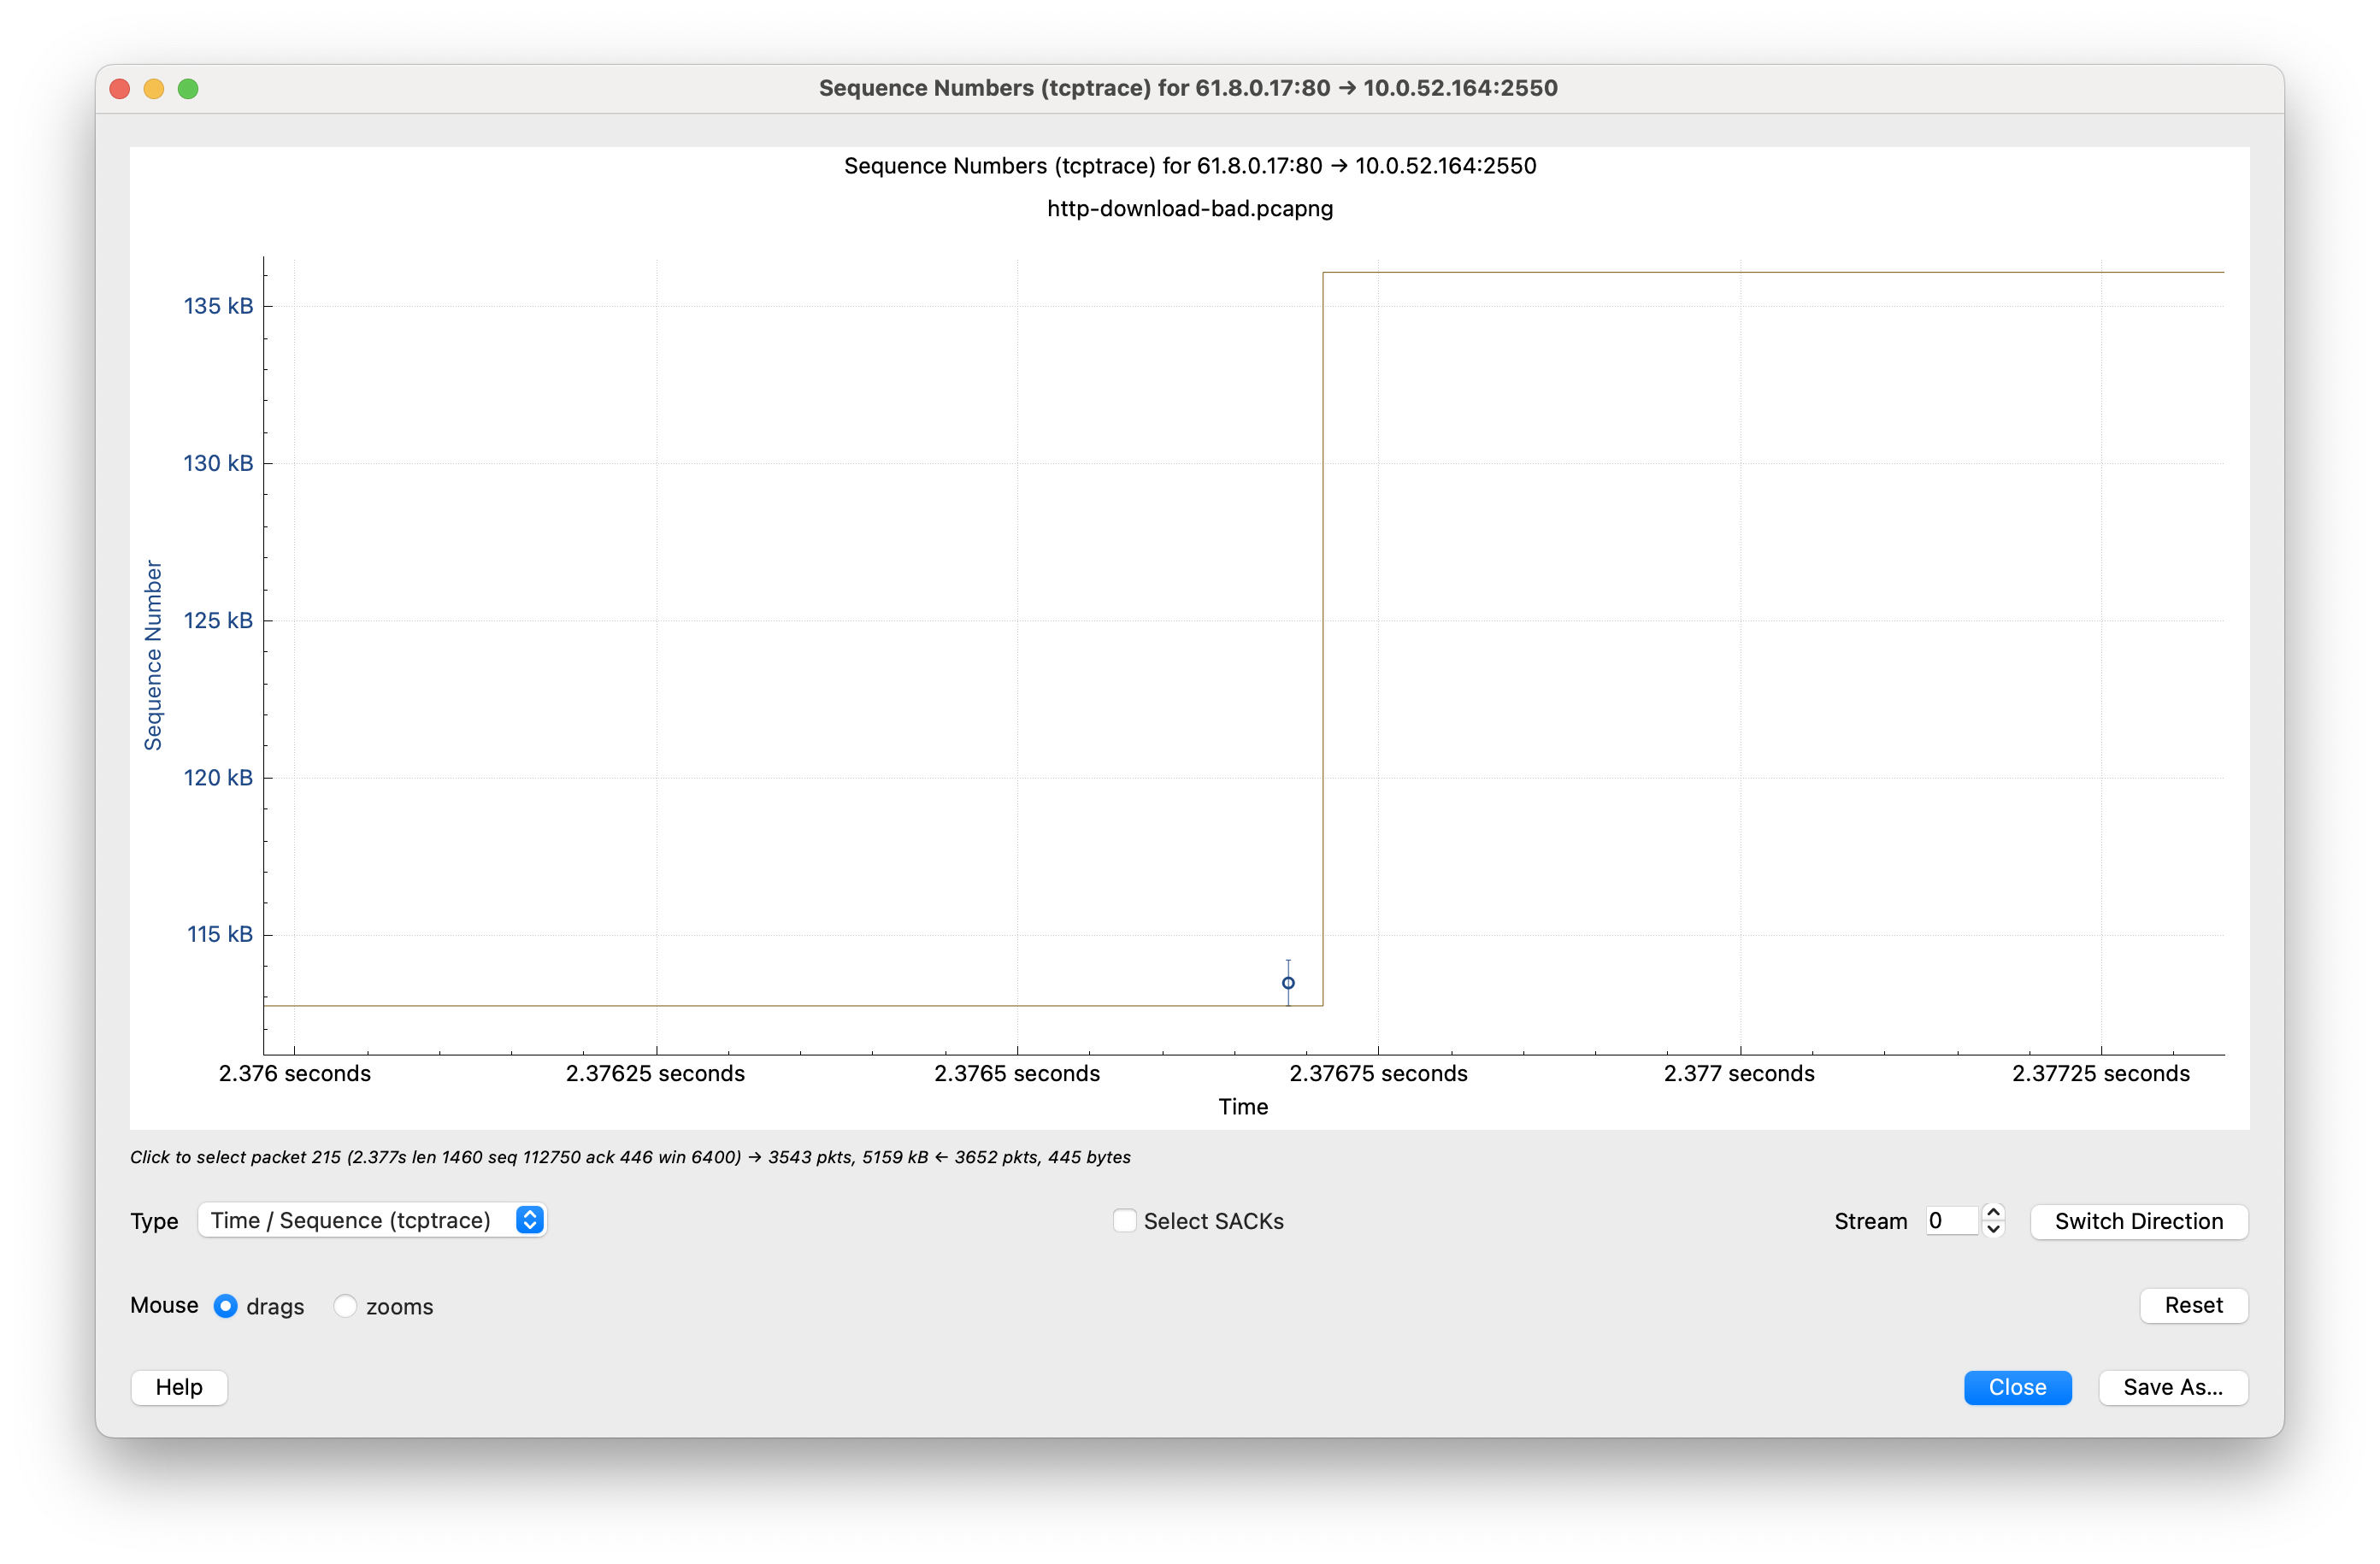
Frame 216 fills the gap between the cumulative ACK and the left edge (LE) of the SACK block, this results in an ACK that now includes the newly received data segment as well as the previously received data segments. This is shown by the (cumulative) ACK being increased, represented by the brown line being raised:

image description

edit flag offensive delete link more

Comments

Hello, Thank you for the quick reply. I agree with your explanation, this is not the part that is problematic for me. I have uploaded a picutre with annotation here. Points I do not understand are 3 and 5. Regards,

rmdck gravatar imagermdck ( 2025-09-01 13:34:41 +0000 )edit

Regarding 3: When there are multiple SACK blocks present in the TCP options, then the first one (which included the most recently received TCP segment) will be plotted in "red" and the other SACK blocks are plotted in "brown".

Regarding 5: There is limited space in the TCP header (ie max 60 bytes, so max 40 bytes for options), which means there can be more disjunct SACK block than fit in the header. Also, adding the most amount of SACK blocks is listed as a SHOULD in the RFC and not as a MUST. So a previously seen SACK block can be omitted in subsequent DUP-ACKs if there is either no room for it, or the specific SACK implementation is only sending a specific amount of SACK blocks. In this case, the receiver of the data is sending 2 SACK blocks even though there is room for sending 3 SACK blocks.

SYN-bit gravatar imageSYN-bit ( 2025-09-01 16:56:35 +0000 )edit

Your Answer

Please start posting anonymously - your entry will be published after you log in or create a new account.

Add Answer

Question Tools

1 follower

Stats

Asked: 2025-08-28 14:44:45 +0000

Seen: 90 times

Last updated: Sep 01