
tcptrace graphic analysis
Hello,
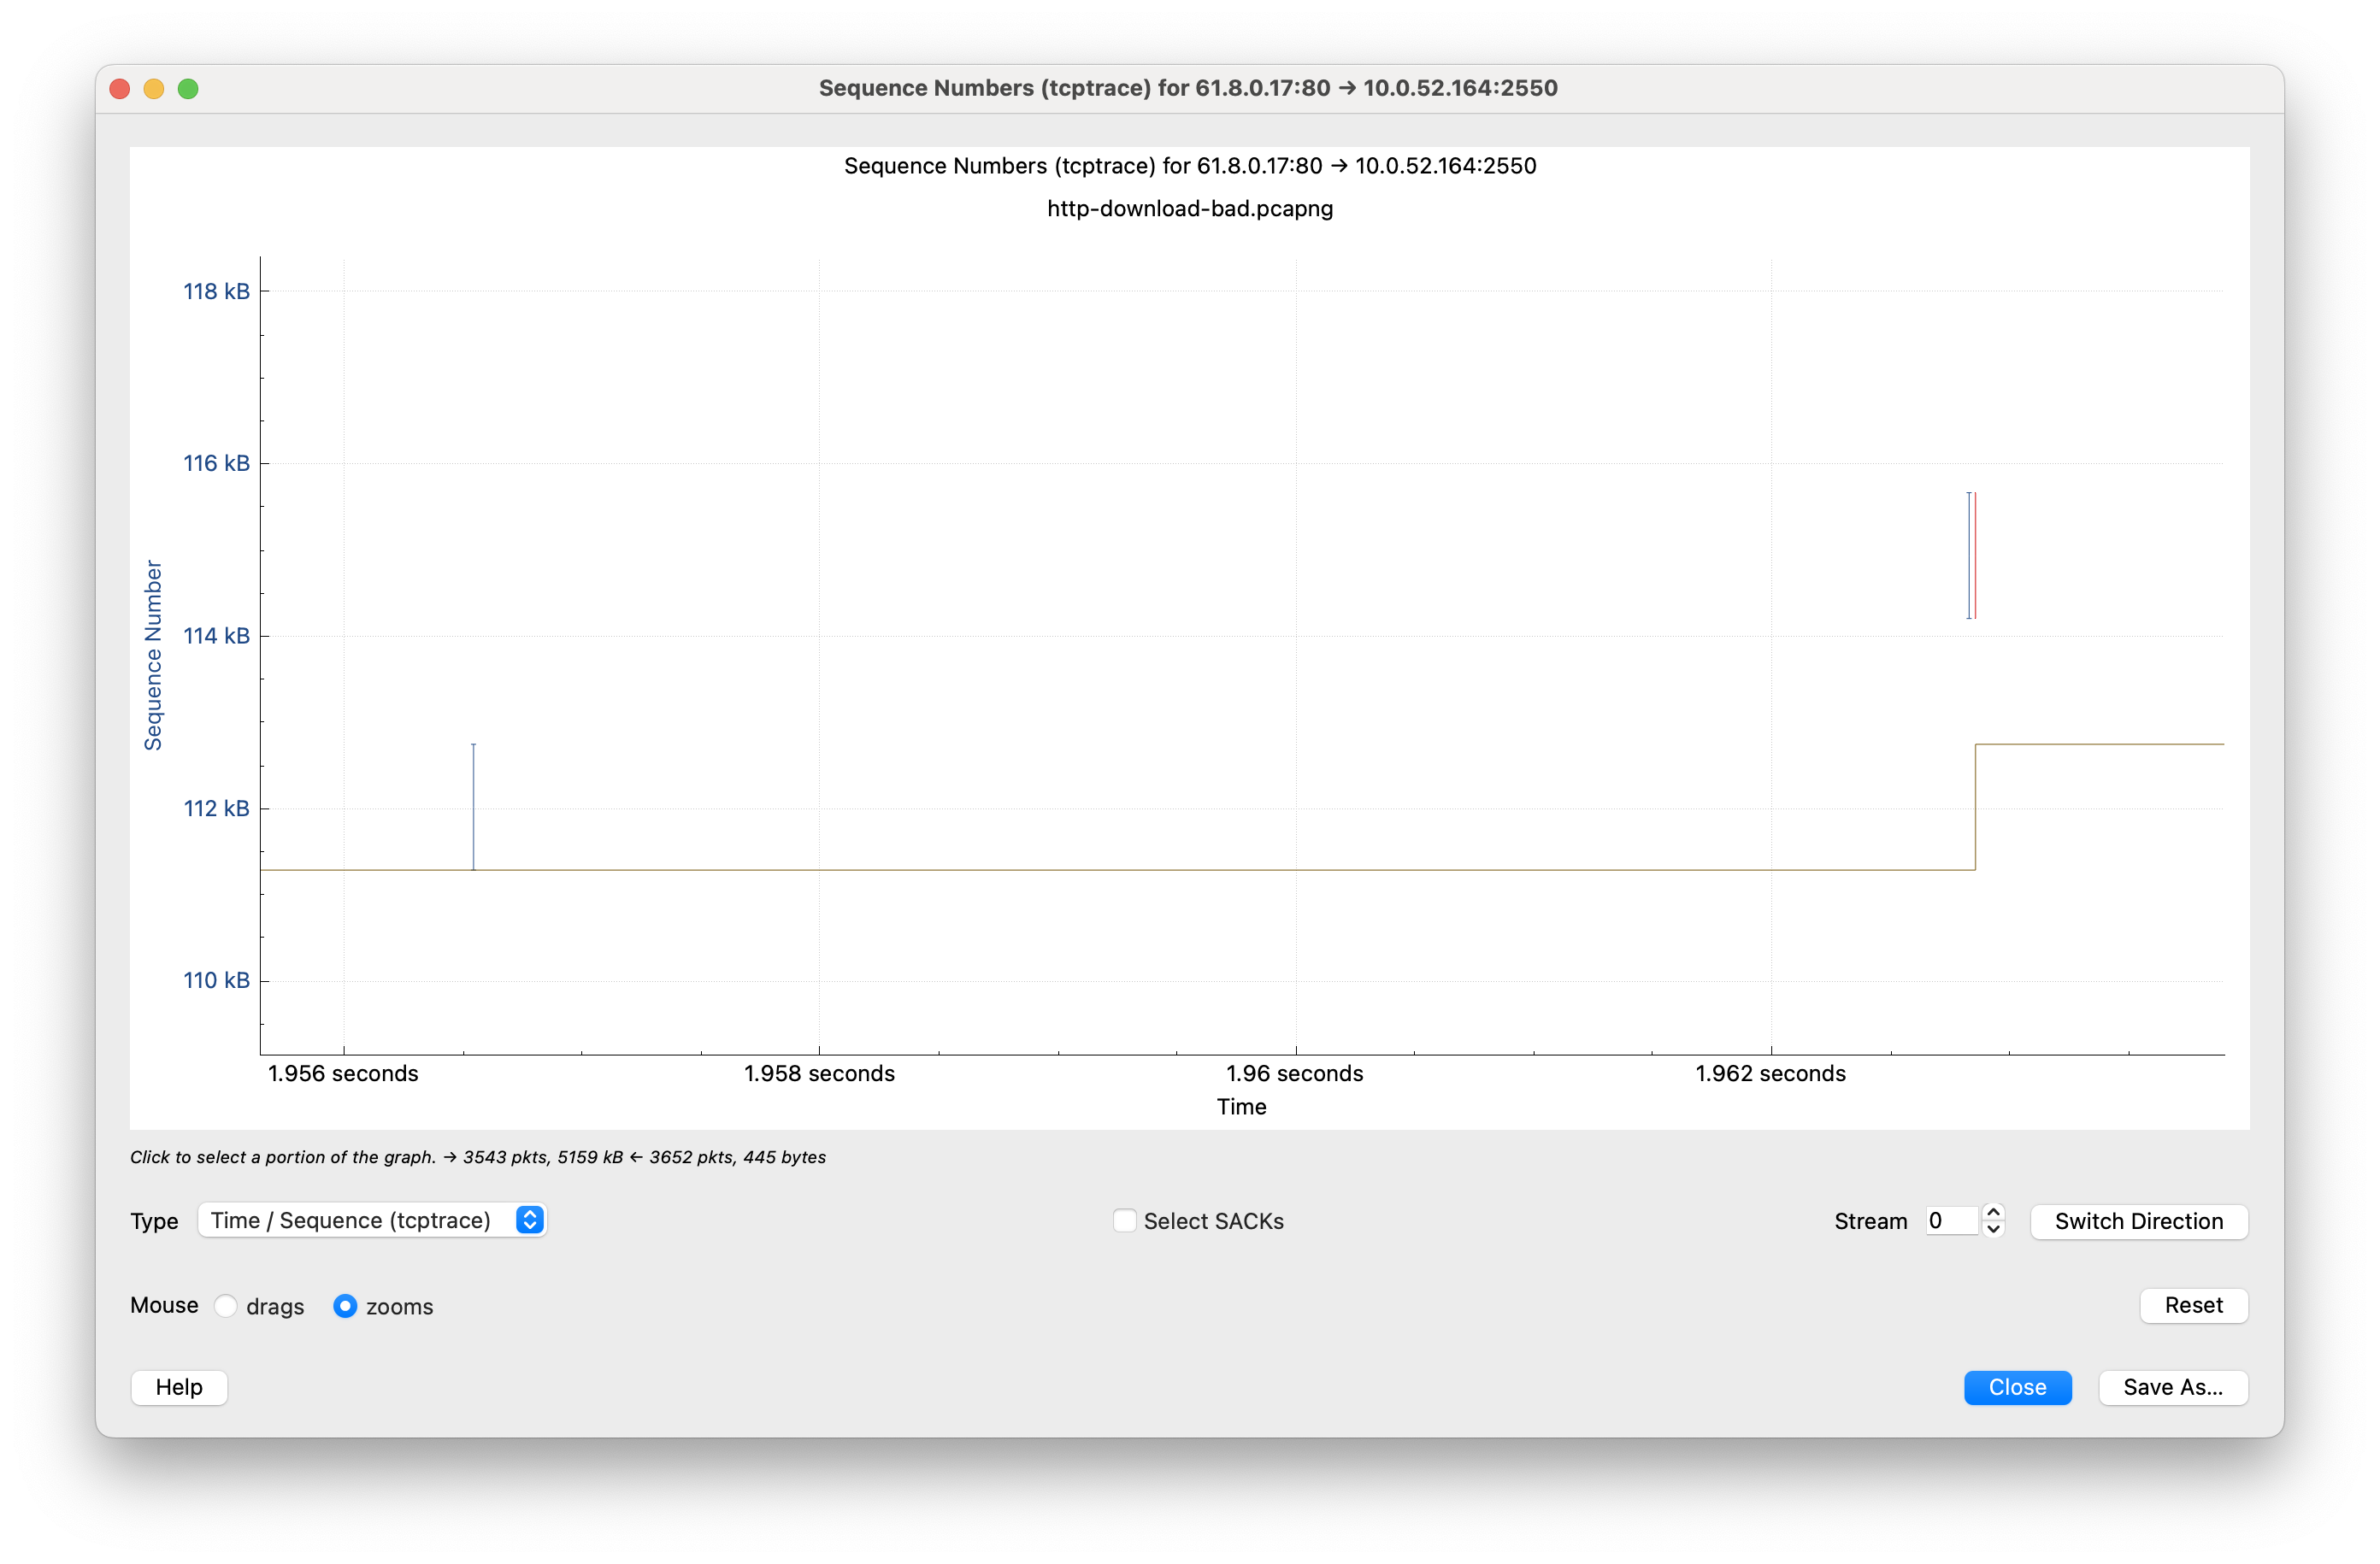
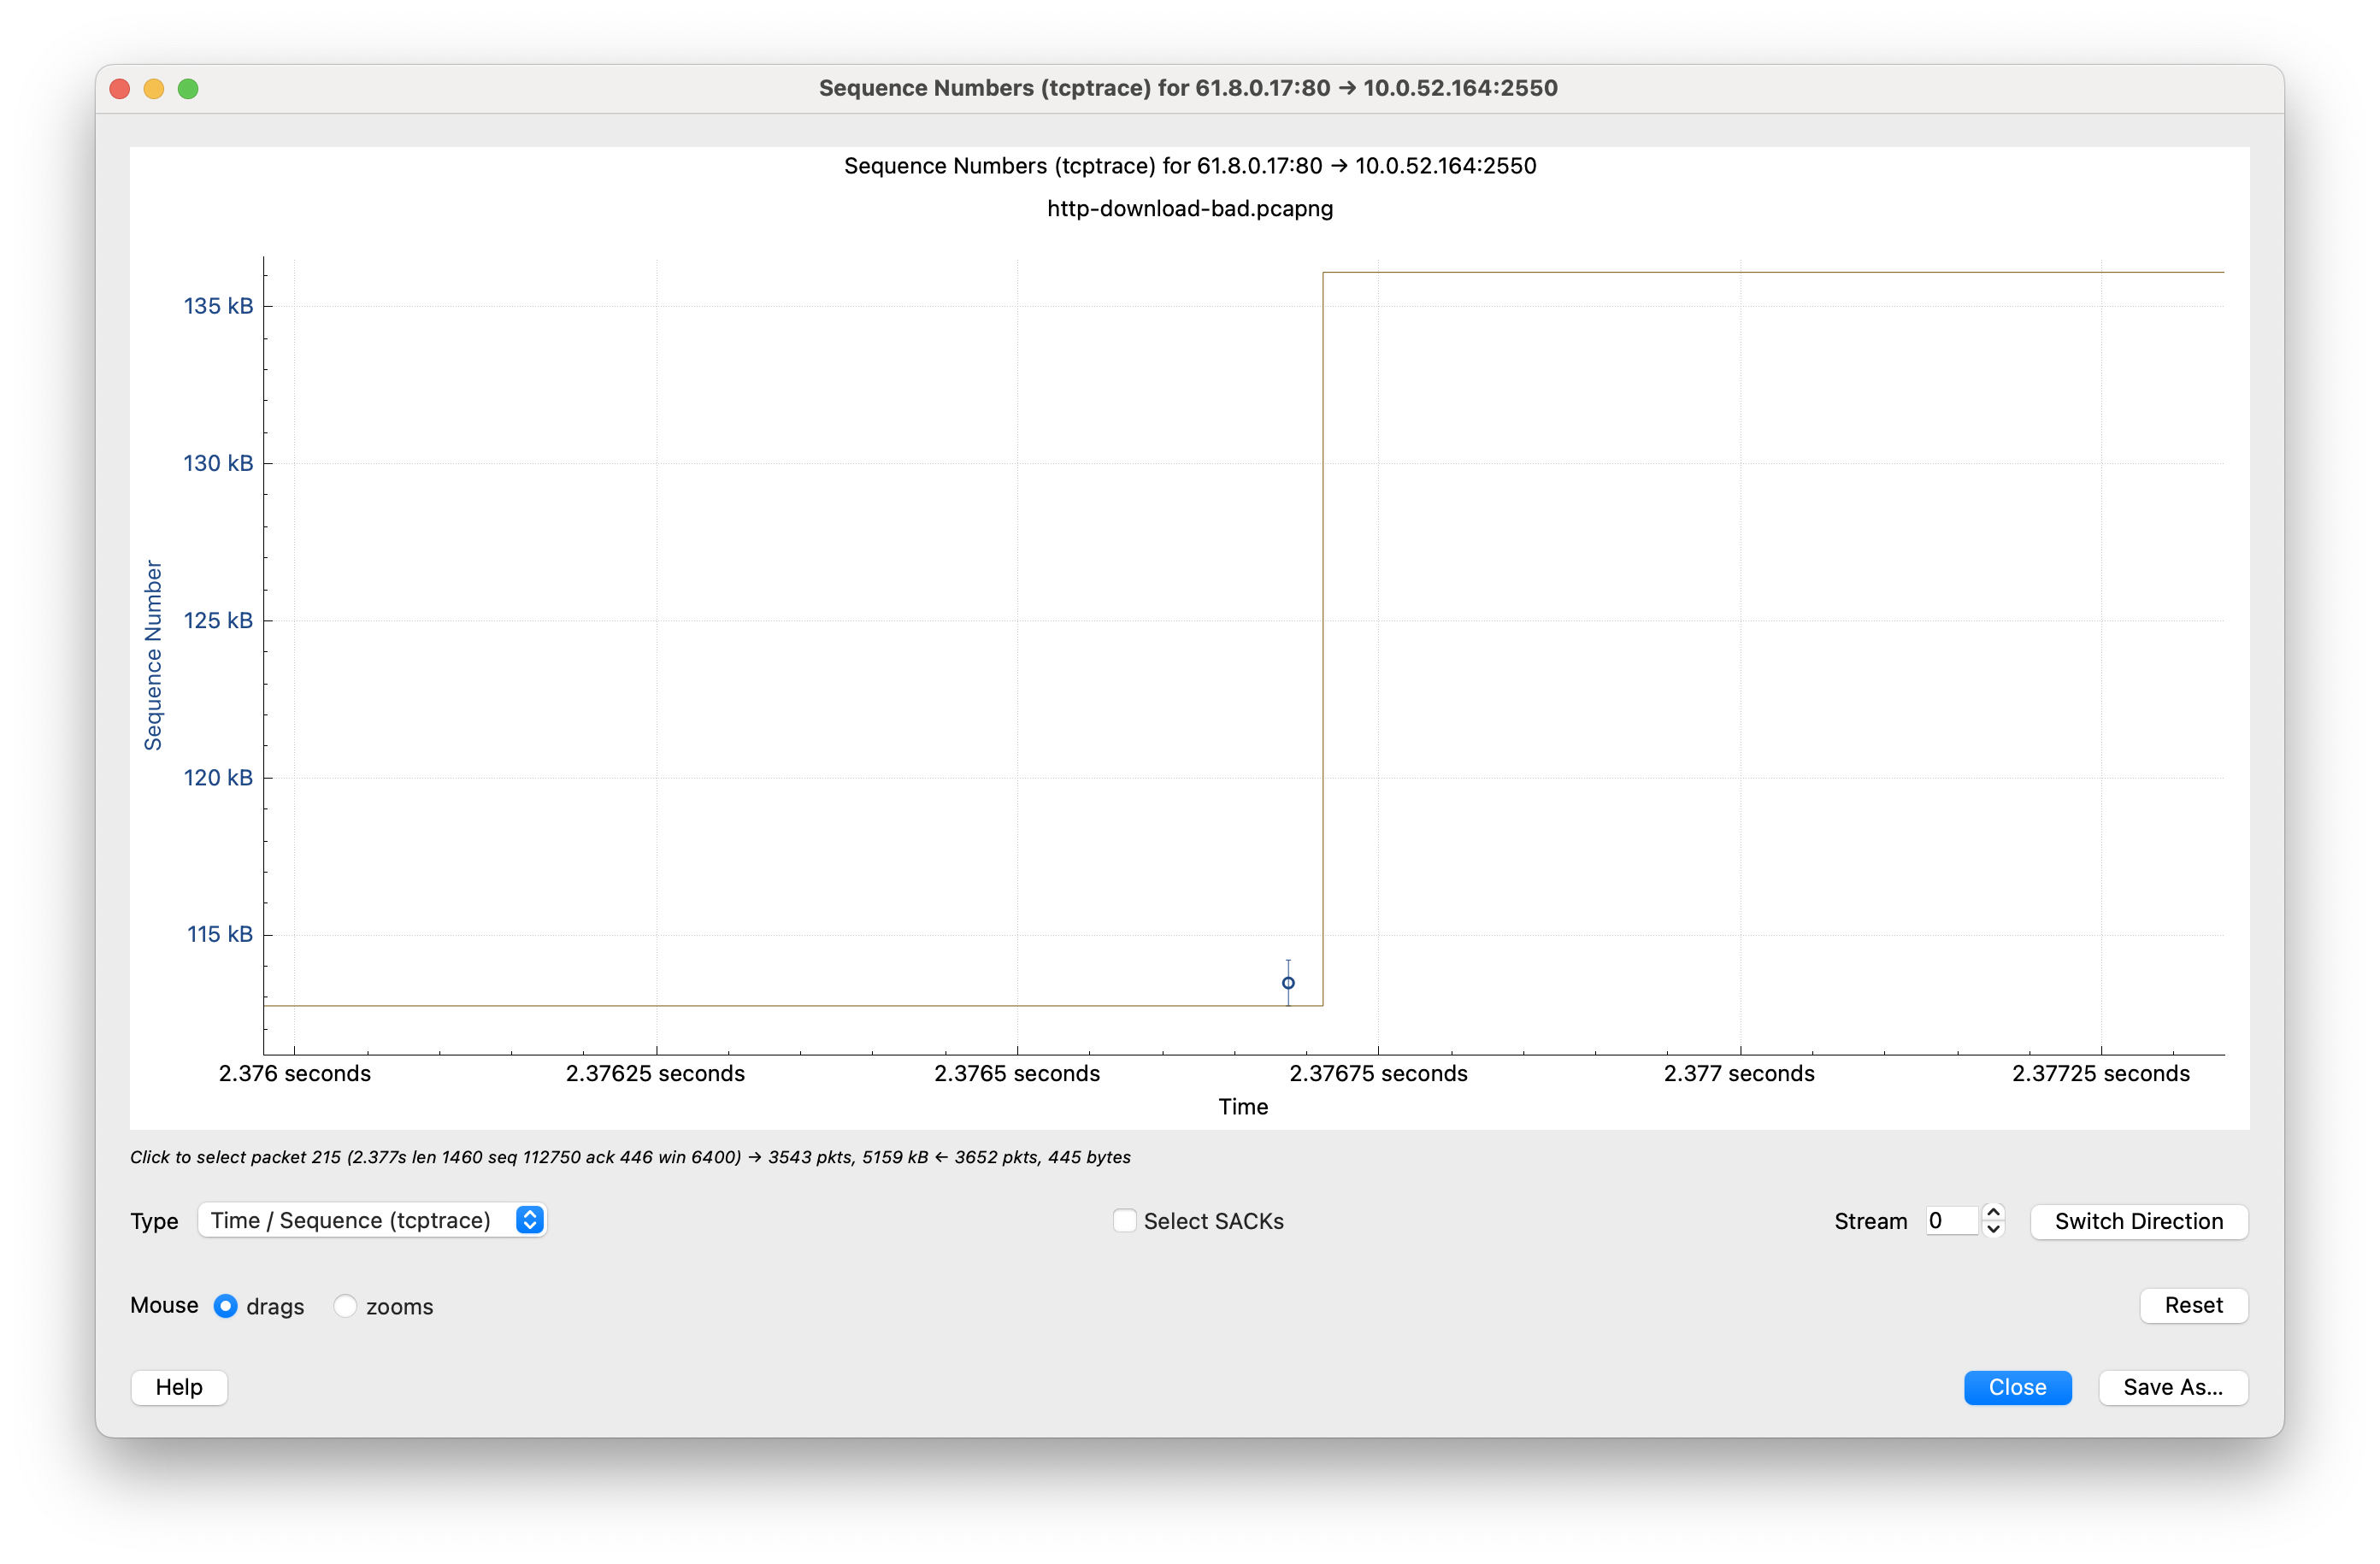
I am working on the http-download-bad.pcapng from wireshark (uploaded here in order to udnerstand tcptrace graphic. The graph is made from 61.8.0.17:80 -> 10.0.52.164.2250
From packet 133, we have packet loss and from pkt 135 in the graph there is a vertical red line under the "I". This line grows up until packet 163 and then, a brown line appears in the graph and the red line is reduced. From my understanding brown lines are sack block form the tcp receiver whereas red lines are duplicate ack from the sender. But the graph does not reflect it. I probably misunderstood something. Can you clarify me the graph? Thanks

Wireshark version, there have been changes in this area over the years?
version: 3.6.2 (Git v3.6.2 packaged as 3.6.2-2) Linux.