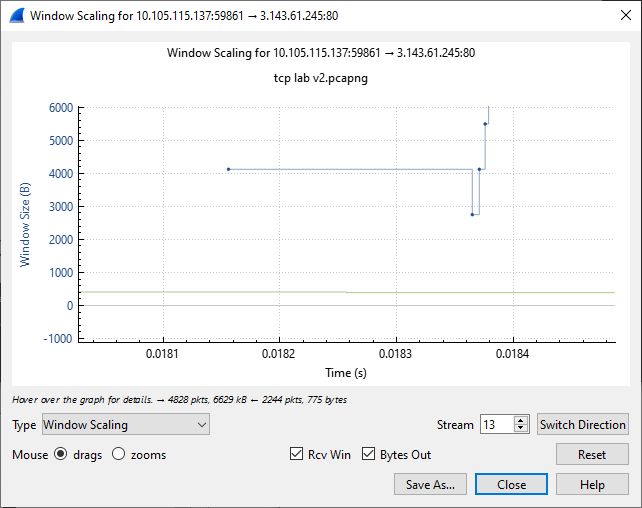
Need help with the Window Scaling Graph
So I cannot understand the y-axis of the Window Scaling Graph, and this is the trace file I'm look at: https://drive.google.com/file/d/1jDqo...
And this is the Window Scaling Graph: https://drive.google.com/file/d/1IVYB...
Now I'm looking at the traffic from 10.105.115.137 to 3.143.61.245. If I follow the first dot showing up in the graph, I get packet No 193. And according to the Y-axis of the graph, the Window Size of the receiver 3.143.61.245 should be around 4000 Bytes. However, if I go back to the trace and find the latest ACK from the receiver to 10.105.xxx, I dob't think I could relate the 4000~ Bytes with the Window Size displayed in the captured segments.
The latest ACK before packet 193 was sent was packet 192, which has a Window Size of 409 Bytes. So from my understanding, this should be the suggested window size by the receiver? How does the Window Size field relate to that displayed on the Graph?
I might have misunderstanding in concepts, so please leave any inputs!

