
Win7 workstation -> LAN -> ASA -> Cisco ASR -> DMVPN -> ASR -> Palo Alto -> Nexus -> NetApp We are experiencing the symptoms described in the title. This is not new, it predates me, and it happens at multiple spoke sites in our DMVPN. Each vendor just seems to point the finger at the other with no real data reinforcing their point. Cisco has cleared any real issues at the hardware level.
asked 28 Sep '16, 11:57 wdurand showing 5 of 15 show 10 more comments |
3 Answers:
At the end of my talk about SMB2 during Sharkfest Europe I have invited the attendees to look at this post to get a feeling for the protocol. I guess, people are interested in SMB2 since the view counters went up over the last week. My analysis can be found on Jasper's blog as it became too big for this website. Any comments, add-ons etc are very welcome. answered 28 Oct '16, 12:33 packethunter |
This is a complex problem and to properly understand what is going on, we need to understand:
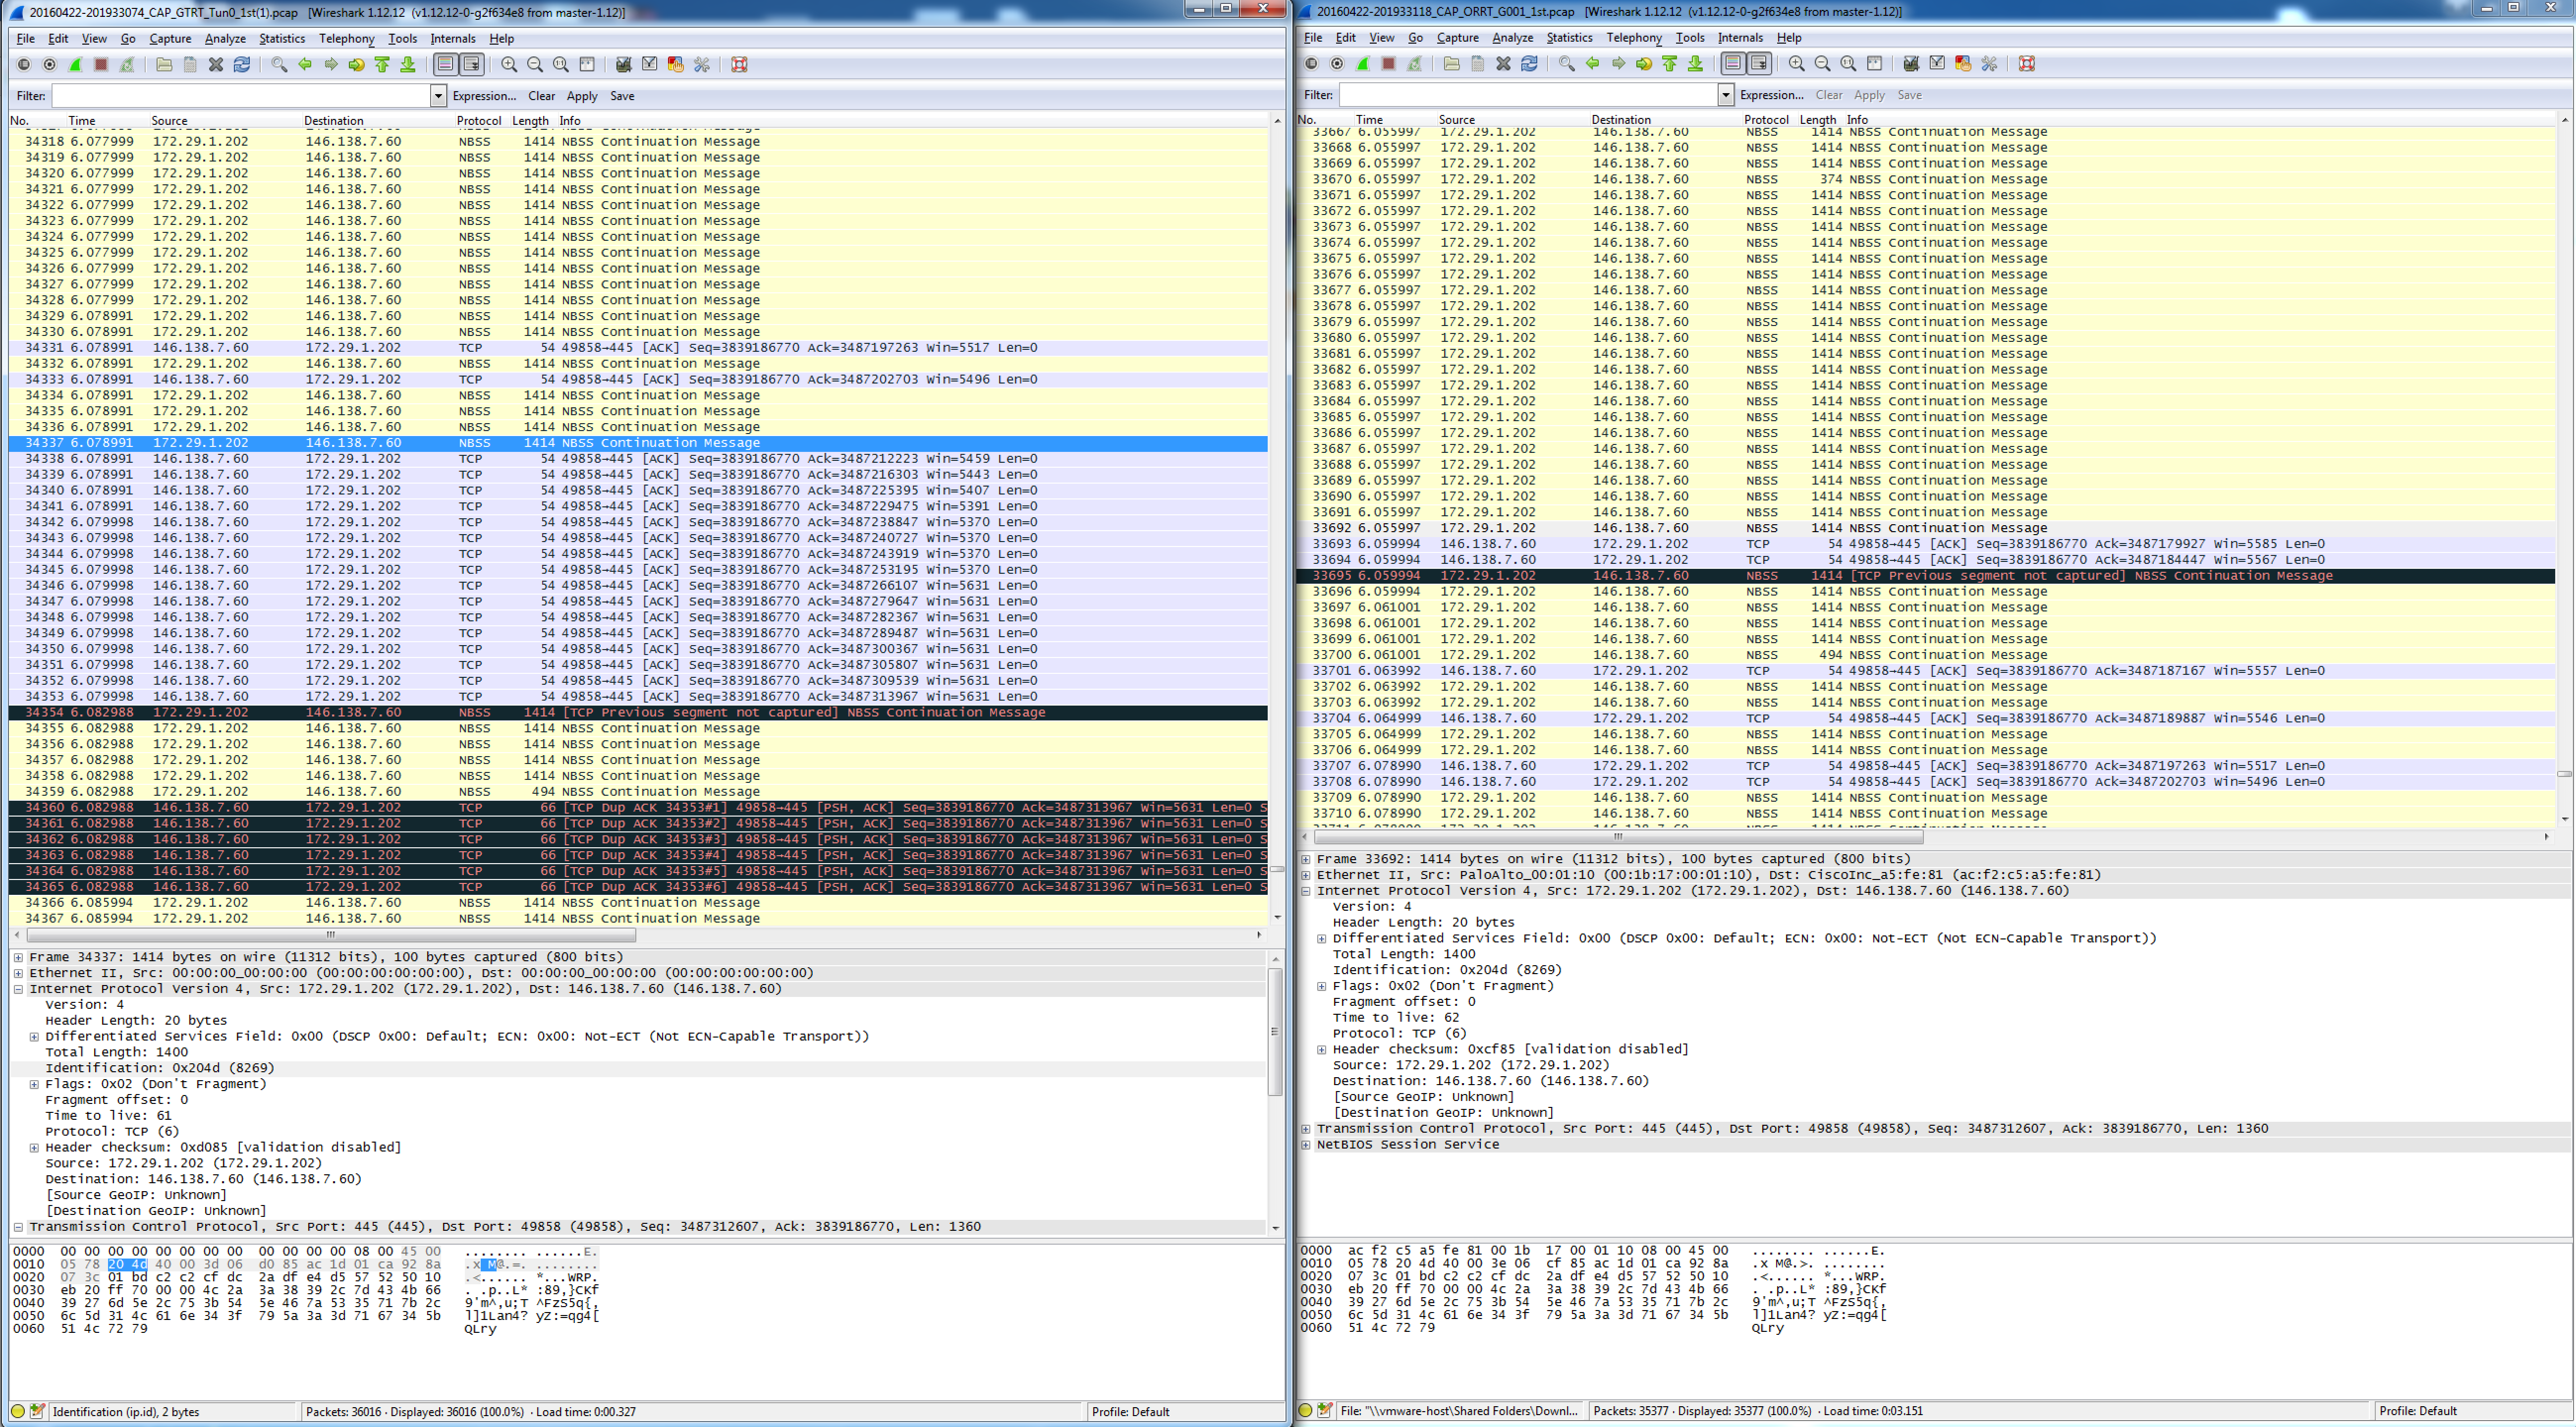
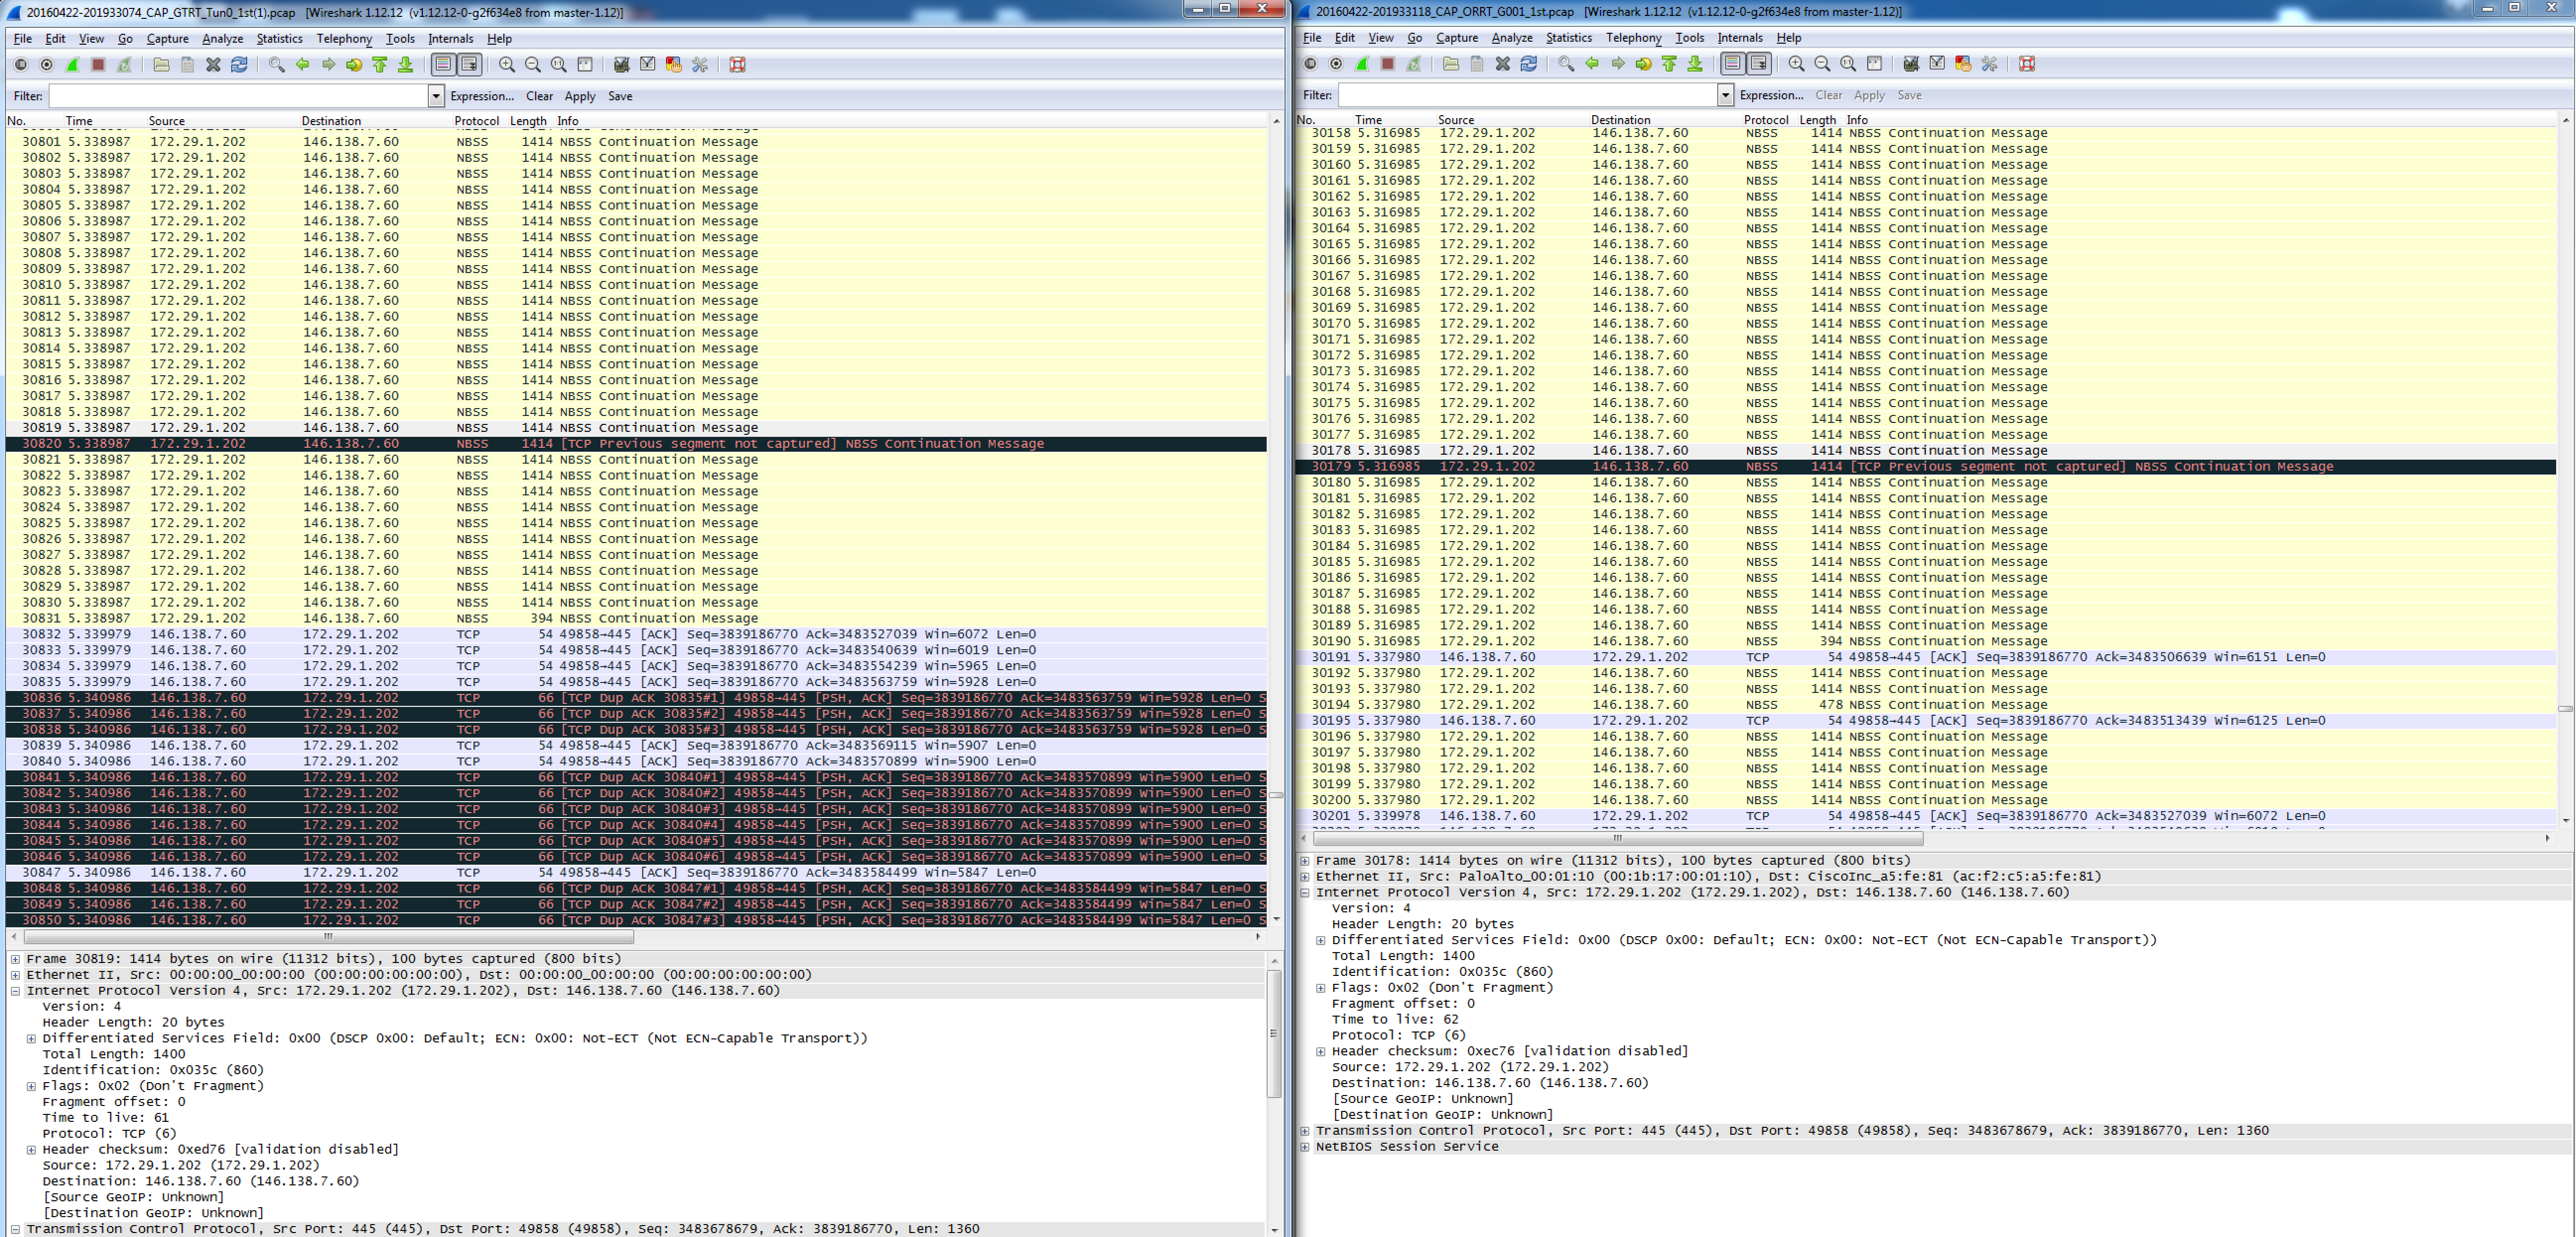
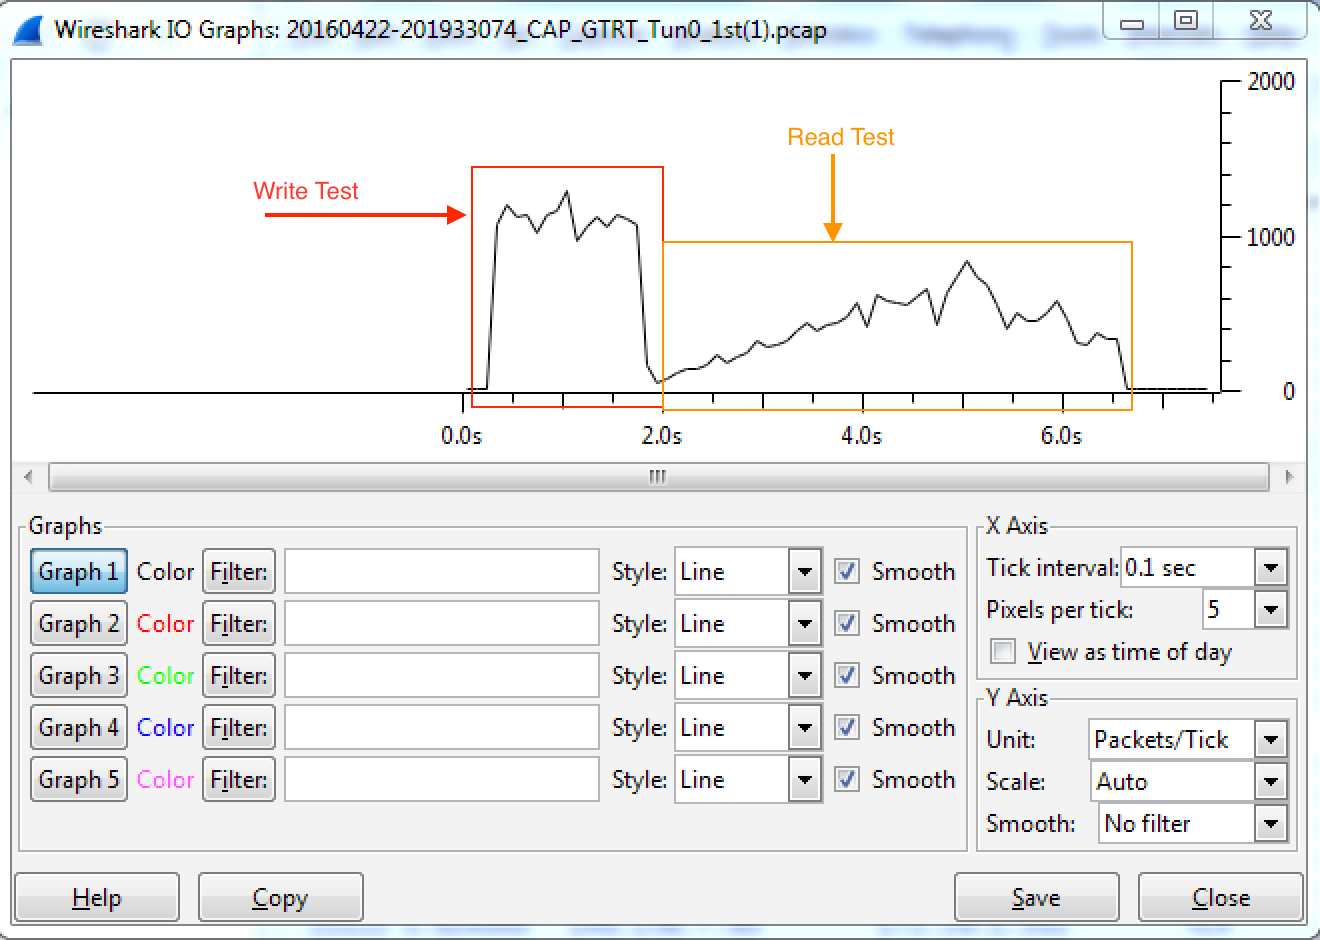
This problem is also addressed in a set of 4 articles on www.lovemytool.com. The first 2 articles are already there and the following 2 articles will be published approximately a month apart. http://www.lovemytool.com/blog/2016/12/slow-writes-slower-reads-by-bob-brownell.html Those articles contain detailed charts that visually display the behaviours involved. Only a summary of the relevant observations is provided here. Here is the network "diagram": Win7 workstation -> LAN -> ASA -> Cisco ASR -> DMVPN -> ASR -> Palo Alto -> Nexus -> NetApp Note that the PC where the captures were taken is on the left hand side and we have an ASA firewall on the local side of the DMVPN WAN. Thus, any packet losses or OOO packets that occur on the other side of that ASA are hidden from us. We have to infer them from the received SACKs, redundant retransmissions and the timing of those events. Findings - Both Directions: 1) The underlying cause of the throughput reductions are out-of-order packets (OOO) on the other side of the local ASA firewall. That is, somewhere between the local ASA firewall and NetApp. Win7 workstation -> LAN -> ASA -> Cisco ASR -> DMVPN -> ASR -> Palo Alto -> Nexus -> NetApp |<---- Out of Order Packets Occur Somewhere Here ---->| 2) Very early in each transfer, during the "Slow Start" ramp up, OOO packets and their respective SACKs or Dup-ACKs generated from the receiver cause the sender to enter "Congestion Avoidance" mode. This involves halving the transmit window (often multiple times) and then ramping up linearly (just one extra packet is added per round trip). This is the underlying cause of the "sawtooth" throughput patterns. 3) The minimum round trip time (RTT) between the PC and NetApp is 22.9 ms. 4) All SMB requests are handled in blocks of 64 KB. Observations (C-to-H): a) We are sending the data, so we see the data packets leave the PC in the correct order. b) The slow start ramps up to 102 packets in flight after just 8 round trips. Just for interest, the server's Receive Window is 300 KB at this point. c) However, we then receive SACKs from the NetApp (starting with packet #608). d) These SACKs indicate that data packets #499 to #572 were not received but #573 to #606 were. e) Based on the SACKs, our PC begins to retransmit that large data block, as #615 to #736. f) Just 1.2 ms after the first SACK, we receive normal ACKs acknowledging the whole original block of 102 packets. g) Given the RTT of 23 ms, those ACKs can only mean that the original block of 102 was eventually received intact. The SACKs tell us that #499 to #572 must have been overtaken so that #573 to #606 arrived at the NetApp before them. Packets #499 to #572 probably arrived at the NetApp just 1.2 ms late. h) Due to the apparent (but we know not real) large packet loss, the PC halved its transmit window so that only 54 packets are sent in the next burst (#609, #614, #737-#791). Halving packets per round trip is halving the data throughput. i) Interestingly, we receive several Dup-ACKs indicating that #609 was not received so we retransmit it as #801. j) Just 2 ms later, we receive normal ACKs for all 54 packets. Again, we can infer OOO at the receiving NetApp. k) This additional "packet loss" triggers a further halving of the PC's transmit window. Just 25 packets (#838 to #862) are transmitted in the next burst. l) Since we're now in "Congestion Avoidance" mode, subsequent packet bursts increase by only one packet per round trip. We see 26, 27, 28, ... packets per round trip eventually ramping all the way up to 539. We remain in "Congestion Avoidance" mode for the rest of the file transfer, never seeing "Slow Start" again. This is why we observe the linear throughput increase until the end. m) As the TCP data throughput ramps up, the PC is able to include more and more 64 KB SMB blocks in each TCP round trip. Thus, the PC increases its concurrent SMB write requests to fill the available throughput. m) 539 packets is around 730 KB, so the final round trip delivers data for 12 SMB blocks (at 64 KB each) in the final burst. n) Just out of interest, the server keeps stepping up its Receive Window so that it is always approximately double what we are transmitting. Observations (H-to-C): A) We are receiving the data, so the activity on the sender side of the local Cisco ASA firewall is hidden from us. B) The ASA receives packets out-of-order on the other side, sends its own SACKs back to the NetApp then buffers packets until "gaps" are filled. Only when it has packets in the correct order does it release them to us. C) The server's slow start ramps up to 79 packets (107 KB, #735 to #821) in flight after 13 round trips. Just for interest, the client's Receive Window is 1 MB at this point in time. D) The PC transmits ACKs for all those data packets but then receives 24 unnecessary retransmissions (#824 to #870) in about 1 ms less than the minimum RTT. These are non-contiguous and represent just 24 of the 79 packets in the previous "burst". E) 2.2 ms after the first retransmission, we receive the next full "burst" of data packets - which is now halved to 39 packets (#872 to #914). F) From the "C-to-H" trace, we know that the OOO occurs on the other side of the local ASA firewall. From the retransmissions and their timing, we can infer that the first 21 packets of the burst of 79 arrived at the other side of our local ASA out-of-order and later than the others in the burst. G) We infer that the ASA sent SACKs back to the NetApp, informing it that the first 21 (and 3 more non-contiguous packets) were not received. H) However, once the local ASA received the 24 late packets (which were only about 1 ms late) it released the full original burst of 79 packets to us in the correct order. I) The NetApp responded to the ASA's SACKs by retransmitting the 21 + 3 "missing" packets. The ASA then passed those retransmitted packets straight through - which we observe in the trace as unnecessary retransmissions. J) When the NetApp received our PC's ACKs for the full burst of 79 packets, it ceased retransmitting and sent the next normal burst. However, since it had detected "packet loss" it halved its transmit window so that this burst was just 39 packets and is now in "Congestion Avoidance" mode. I) Our PC transmitted D-SACKs (#828-#831, #835-#837, #843-847, #855-861, #865-867, #869, #871) in response to all 24 unnecessary retransmitted data packets (#824 to #870). J) The NetApp interpreted those D-SACKs as normal Dup-ACKs and retransmitted yet another unnecessary packet (#916). Due to these further apparent packet losses, it further halved its transmit window to just 19 packets in the next burst. K) Being in "Congestion Avoidance" mode, the NetApp increases its subsequent bursts by just one packet per round trip and we observe the following round trips delivering bursts of 20, 21, 22 and 23 packets. L) The OOO behaviour as above (D)-(J) re-occurs several times, causing all those "sawtooth" changes in the observed throughput. At the best point in the flow, we manage to achieve 424 packets (575 KB) per round trip. M) To help you follow along, packets #3221 and #172758 are just two examples of unnecessary retransmissions at the start of transmit window halvings. N) As well as the Cisco ASA firewall "misleading" us by hiding the OOO activity, the large 2.5 second SRTs reported by Wireshark during the read test are also somewhat misleading. They are not a symptom of any server problem at all. They are a symptom of the way the client requests the data from the server. This can be a story for another day. answered 19 Feb '17, 21:17 Philst |
My 2 cents: C_to_H_200MB: Trace taken on the sender side. Throughput is linearly increasing till 240Mbit/s at the end, like the receiver window size, growing all along. Windows size is not filled from sender point of view. H_to_C_200MB: Trace taken on the receiver side. Throughput grows linearly (max of 180Mb/s), but is stopped each time there's a retransmission, sender seems to be very sensitive to that. I'd make the test with a Linux & macOS client. If changes, I'd check and disable some "Slow start" / Heuristic features of Windows: http://betanews.com/2011/01/20/use-hidden-windows-tweaks-to-speed-up-your-internet-and-network-connections/ https://www.duckware.com/blog/how-windows-is-killing-internet-download-speeds/index.html http://www.speedguide.net/faq/windows-scaling-heuristics-changes-my-tcp-autotuning-339 Else, throughput is high, and RTT of 30ms, I'd try to open more both RX windows size and TX buffer at the beginning of the TCP connection to see if transfer throughput is no longer linearly growing. answered 27 Oct '16, 04:58 TomLaBaude |
Hm hard to tell, with the info you gave. Could share us a tracefile at public accessible palce. You could use https://www.tracewrangler.com/ to do some anonymisation.
Let me know if this works, if not I'll try something else. thanks.
https://www.dropbox.com/sh/o7a5bigcg9aixmm/AADxJRAUGxlwARnG1m0LJVKGa?dl=0
While writing retransmissions can be seen. While reading there are less Bytes in flight. I think it could be a window size problem, but to be more reliable we must see the handshake which is not included in the trace. So we need a new one which has the handshake included.
Update: So I have deleted my first answer, because I spotted some thing that I neeed to investigate. The SMB response goes up in worst case up to 2 sec. And I will connvert this answer into a comment, because at the moment it is no answer for me.
I uploaded a regular Windows file copy of a 1G file to the netapp, C to H, then I did a copy back to the workstation, H to C.
Well as I told without the three way handshake. The trace is not much worth. So maybe you need to disconnect and reconnect the network drive while capturing. Or you could try to reproduce the problem with FTP or SCP???
Okay, so I tried the copy another way. I closed all sessions on the netapp that were associated with my userid.
cifs session close -node SCORSAN01 -windows-user I then started a pcap session, mapped the H drive and transferred a 200MB file up. I repeated the process after disconnecting again and reading the file back to the workstation. Please see captures.
Yes the tracefiles are working. So one question is why 198.207.240.111 only a MSS of 1360 advertises?
I have updated my answer.
That is set on the tunnel interface for DMVPN.
interface Tunnel0 ip mtu 1400 ip tcp adjust-mss 1360 load-interval 30
Ok then it is like I have thought the mss is correct.
Well you try to tune some parameters at both sides, as I think the limitaion is either the receive or the congestion window. But you really should do this very carefully.
Some tuning hints could be found here: http://www.speedguide.net/articles/windows-7-vista-2008-tweaks-2574
and here: http://www.speedguide.net/articles/windows-8-10-2012-server-tcpip-tweaks-5077
and here: http://smallvoid.com/article/winnt-tcp-slow-start.html
An excellent question. We will discuss this at Sharkfest Europe!
Which Palo Alto Networks Firewall is used? Is there a Security Profile in place for the Firewall Rule which matches the session?
What Bandwidth does the WAN have?
The client does increase the amount concurrent read request over time in a linear way. In my test scenario I haven't seen this behavior. Maybe it is due to your iRTT of 23ms? But I don't know for sure as I am not a SMB expert. Maybe You can try to tune the next parameter, but you should do it in very carefully way. Because their might be a very good reason why the default is 0.