Ask Your Question
0

slow transfer in one direction

asked 2023-02-28 05:49:16 +0000

quest4answer gravatar image

Hello i have two sites connected via SDWAN. Checked SDWAN side and dont see any issue from profile or bandwidth control wise. but for some reason site A to Site B is fast and site B to Site A is slow.

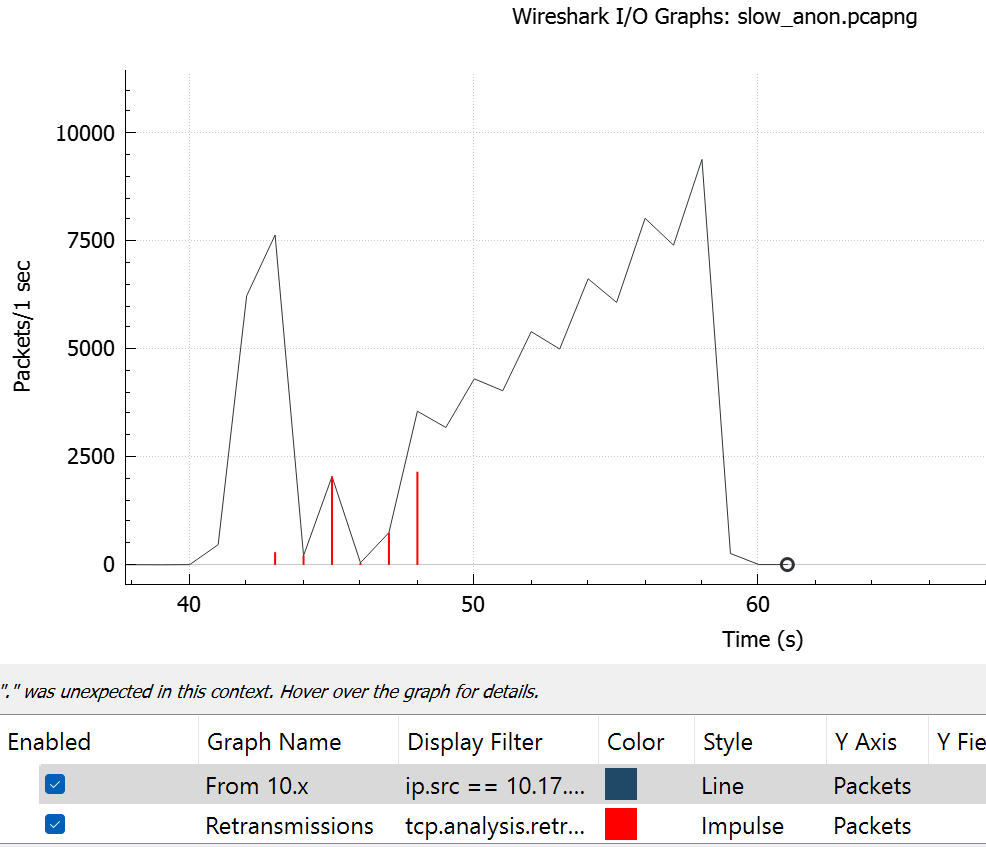
slow transfer https://drive.google.com/file/d/199Rf...

fast transfer https://drive.google.com/file/d/17h8K...

couple of things, i have anonymized both copy for security reasons. I am transferring same file in both directions via SMB. Also i have capture right outside of one of the server. So MSS might show as a 1460 in fast capture vs 1320 on slow capture but please ignore that part due to the location of teh capture.. it shows like. that. MSS is 1320 in both direction due to sdwan overhead.
significant retransmission and out of order packets on slow transfer.. and i don't have both side of the capture right now.. please let me know if you see something pops out.. thanks

edit retag flag offensive close merge delete

4 Answers

Sort by » oldest newest most voted
1

answered 2023-03-21 11:32:47 +0000

updated 2023-03-21 23:32:35 +0000

[Edit] Note: This answer applies to the newer "dest" and "src" PCAPs. The behaviour there is very, very different than in the original "slow" PCAP - where there are very real packet losses and retransmissions. Thus, this answer shouldn't be compared to the other answers here.

The "slow" PCAP deserves its own separate answer.

In "src", I can see that the slow throughput is due to the sender going into congestion avoidance mode due to apparent, but not real, packet losses. Severe out-of-order events (such as one full-sized packet overtaking 9 other full-sized packets) are happening regularly.

For such an example, have a look at packet #53529 in the "src" PCAP. Observe the next 9 data packets as well as the intervening SACKs.

When a packet arrives ahead of where it should be, the receiver sends SACKs implying that packets were missing. However, the missing packets arrive very quickly afterwards (sub millisecond).

When the OOO events are severe enough (very often) the SACKs make the sender believe that there were real packet losses and so it halves its transmit window and then ramps up slowly. Sometimes the sender actually retransmits data packets - causing the receiver to send D-SACKs (indicating that data was received twice).

When 3 transmit window "halvings" occur close together, we end up reducing the transmit window by a factor of 8. The common "increase the transmit window by just one extra packet per round trip" mechanism means that throughput is dramatically reduced.

So your problem is packets becoming OOO. Where and why would full-sized packets overtake several other full-sized packets in your network? I stress the "full-sized" because it is more common for very small packets to overtake big ones.

I'll add some more packet examples when I've had more time to look at the PCAPs.

edit flag offensive delete link more
1

answered 2023-03-02 16:59:21 +0000

SYN-bit gravatar image

This looks like a buffer bloat issue. Data is sent on a high speed network and needs to be forwarded onto a WAN connection with lower bandwidth, this results in buffering. But when the buffer fills up, packets will be discarded. Once the packet-loss is detected, the sending side will reduce it's congestion window and this means less data can be sent per roud-trip time. This results in reduced bandwidth.

In the slow transfer, the max window size seen is ~16MB, this is probably larger than the buffer on the WAN router, which is the why the buffer bloat occurs.

In the fast transfer, the max window size seen is ~256KB, perhaps this was preventing the sending system to overload the buffer.

It could also be that there is different equipment with different buffer sizes on both locations, causing different behavior.

You could try to limit the maximum window size on the receiving system of the slow response. See if it makes a difference.

edit flag offensive delete link more

Comments

assuming you are talking about receive window. i see on both transfer window size 16 MB on both sides...may be i am missing something.. but buffer bloat potentially issue. site B has FW with 10 gig connection site besides sdwan device. and sdwan is connected via 1 gig connection. A doesn't have have FW but just sdwan device..i will dig in more now ..this is good point. Please let me know about receive window though .. thanks

quest4answer gravatar imagequest4answer ( 2023-03-02 18:13:47 +0000 )edit

Oops... you're right, both systems show a receive window of 16MB at some point...

SYN-bit gravatar imageSYN-bit ( 2023-03-02 20:09:24 +0000 )edit

but due to 10 gig to 1 gig.. and seeing rtt difference between two transfers.. and significantly packet loss and out of order packet lost on slow packet capture. seems like bufferbloat. do you think still a valid theory?

quest4answer gravatar imagequest4answer ( 2023-03-02 20:46:43 +0000 )edit

Yes, I still think this could be the issue, it would really help to see a trace of both sides with the rfc1323 option Timestamps enabled, as you can then get an idea of how long a packet was underway.

See also: https://learn.microsoft.com/en-us/pre...

SYN-bit gravatar imageSYN-bit ( 2023-03-03 10:44:59 +0000 )edit

i did another capture .. this time i was able to capture from both sides.. RTT graph..is quite revealing . one question on that source rtt graph shows around 50 ms but destination shows around 150-200 ms.. actual rtt is 160 ms between two servers .. how is 50 ms possible..

. also client(source) side signifcant packet loss and out of order packets server(destination) not so much so it seems like chokepoint before server where i have 10 gig to 1 gig. i also enabled that setting which sake mentioned before capture. but not sure how to trace that..

IO graph is also quite interesting and sender is sending ack/cWN from packet 387

source/receiver https://drive.google.com/file/d/1xsh7...

destination/sender https://drive.google.com/file/d/13Sxx...

quest4answer gravatar imagequest4answer ( 2023-03-03 22:13:25 +0000 )edit
1

answered 2023-04-15 09:43:40 +0000

BobNetD gravatar image

The most useful statistic for investigating throughput problems is bytes-in-flight (BIF) and perhaps no one has shown such a Wireshark chart because either the traffic must be captured at the sender’s end or its long-standing bug can present misleading information. I have used another free tool that complements Wireshark and avoids both weaknesses. My BIF charts have variously been overlaid with graphs of the receive window, a data-sequence graph to show the context of packet losses and other abnormalities, network transit times, and a graph of data throughput. They show how the various flow-control decisions and network events affect throughput. Unfortunately WS won’t allow me to show you the charts here but they can be found through the link in my profile.

For the ‘slow’ capture as seen by the sender, bytes-in-flight rose rapidly in slow-start mode until, with almost 8 Mbytes in flight, there were heavy packet losses. Initially, packets were lost at a regular rate of 27 in every 30, consistent with tail drops from a queue formed where link speed dropped by a factor of ten. Two thirds of BIF (5.3 MB) was lost at this stage.

The sender responded quickly to the selective acks from the receiver, but after a large burst of retransmissions the sender apparently ignored some of the later SACKs and became particularly cautious, retransmitting only one packet and roughly doubling the number of packets in successive round-trips as in a slow-start mode. There were two such sequences of doubling retransmissions starting with one packet. Consequently, recovery of all the lost data took nearly six seconds. Then the congestion window was set very small and opened slowly in congestion avoidance mode. These flow-control events were responsible for the overall slow throughput.

Throughput climbed slowly to only 90 Mbps and there were no more packet losses. Unfortunately, file transfers that begin with an aggressive slow-start build-up and produce heavy packet losses like this are very common. I agree with the consensus that buffer bloat from this transfer traffic alone should be avoided by limiting the receive window to 7 MB or less.

The BIF chart for the fast transfer tells a quite different story. This TCP driver had set a slow-start threshold at only 2 Mbytes and that avoided packet losses entirely. Near the end, when BIF reached 5.2 MB and throughput was about 210 Mbps, some packets must have arrived out of order. The resulting SACKs prompted a few retransmissions and corresponding reductions in the congestion window, in three steps of roughly 30% each. We know the retransmissions were unnecessary because each one generated a D-SACK from the receiver. Without more samples we can’t tell why a slow-start threshold was set at such a low point, but I believe many drivers will do this after recovering from large packet losses.

A more important question is why, with the path’s bottleneck speed said to be 1 Gbps, packets were overtaken when BIF was about 5 MB and throughput ... (more)

edit flag offensive delete link more
0

answered 2023-03-02 22:14:32 +0000

Eddi gravatar image

Most remarkably, the slow transfer file shows quite a number of retransmissions, where the fast transfer does not show so many. I have plotted the number of packets send by the server vs. the retransmissions (in red).

image description

It's interesting to see, that the time interval of 44 sec onwards has ACK-times of up to 2 seconds. Try the display filter tcp.analysis.ack_rtt > 1 for fun.

The server has a constant TTL of 124. Is it possible, that a topology change has happened in the WAN or in a carrier network (SD-WAN or whatever)? Or a failover on L2 somewhere? A failover from one WAN-link to another?

@SYN-bit could buffer bloat cause these looong RTTs?

edit flag offensive delete link more

Comments

this behavior is consistent ..always bad in one direction. also we are seeing packets drop in output queue in one of the layer 2 switch where our fW is connected but its managed by MSP and so little complicated to do the packet capture there but buffer bloat theory make sense with packet drops in output queue. Interestingly its only in one direction. .. when you copy from FW site B to Site A issue exists .. but if you from from Site A to FW site b issue doesnt exist.

quest4answer gravatar imagequest4answer ( 2023-03-02 22:49:15 +0000 )edit

@Eddi You got me triggered with you RTT observation, so I analysed the first occurrence of an ack_rtt>1. It appears that Wireshark will only calculate the ack_rtt when it sees a full ack for that segment. So with all the intermediate frames being lost, it will report when the missing data has been received. When Wireshark would also look at the SACK options, it would know the actual RTT of the DUP-ACK for a packet is low.

You can see this with the filter tcp.options.sack_re==16205681 || tcp.nxtseq==16205681 || tcp.ack==16205681. After 111 microsecnds, the segment is DUP-ACKed, and it is only after 1 second that the missing pieces are found and the segment is fully ACKed.

SYN-bit gravatar imageSYN-bit ( 2023-03-03 10:41:54 +0000 )edit

Your Answer

Please start posting anonymously - your entry will be published after you log in or create a new account.

Add Answer

Question Tools

1 follower

Stats

Asked: 2023-02-28 05:49:16 +0000

Seen: 821 times

Last updated: Apr 15 '23