Ask Your Question
2

macOS SMB uploads to Windows Server share hang for dozen of seconds

asked 2021-03-30 18:31:37 +0000

TomLaBaude gravatar image

updated 2021-04-05 10:11:21 +0000

Update #1 : Server is not Windows Server but directly a NAS PowerScale Dell/EMC - OneFS OS v8.2.2

Update #2 : A sliced trace with 78 bytes is available here : Deleted

Update #3 : New trace sliced dynamically after TCP header by @SYN-bit (previous fixed slice at 78 bytes was cutting TCP header in case of several SACK blocks, leading to confusion) https://iwaxx.com/stuff/Transfert-Mac-ko-anon.gz.pcap

Good old TCP analysis guys !

Context :

1st quick troubleshoot at a customer, not all traces are ok, not all info from them, but I'll go back for them

The problem :

  • On some specific sites only (private optical fibers between sites in same city : iRTT is 0.2 ms in this example, and always inferior to 1ms)
  • macOS 10.15.7 uploads of a 40GB folder to a PowerScale NAS share hang for dozen of seconds or even stop with an error
  • Downloads seem to be fine on macOS
  • Windows 10 clients don't have any problem
  • Server is a NAS PowerScale (ex-Isilon) Dell/EMC - OneFS OS v8.2.2

First analysis :

  • Upload to server, trace is made directly on client
  • iRTT is 0.2ms
  • SACK permitted on both sides
  • Timestamps enabled on both sides
  • Client window size coeff : x128 (max: 8MB)
  • Server window size coeff : x64 (max: 4MB)
  • Network is loosing packets for sure, looks like burst in switch -> will investigate that appart
  • My question here is on the difference of TCP behavior of the server & between Windows and macOS.

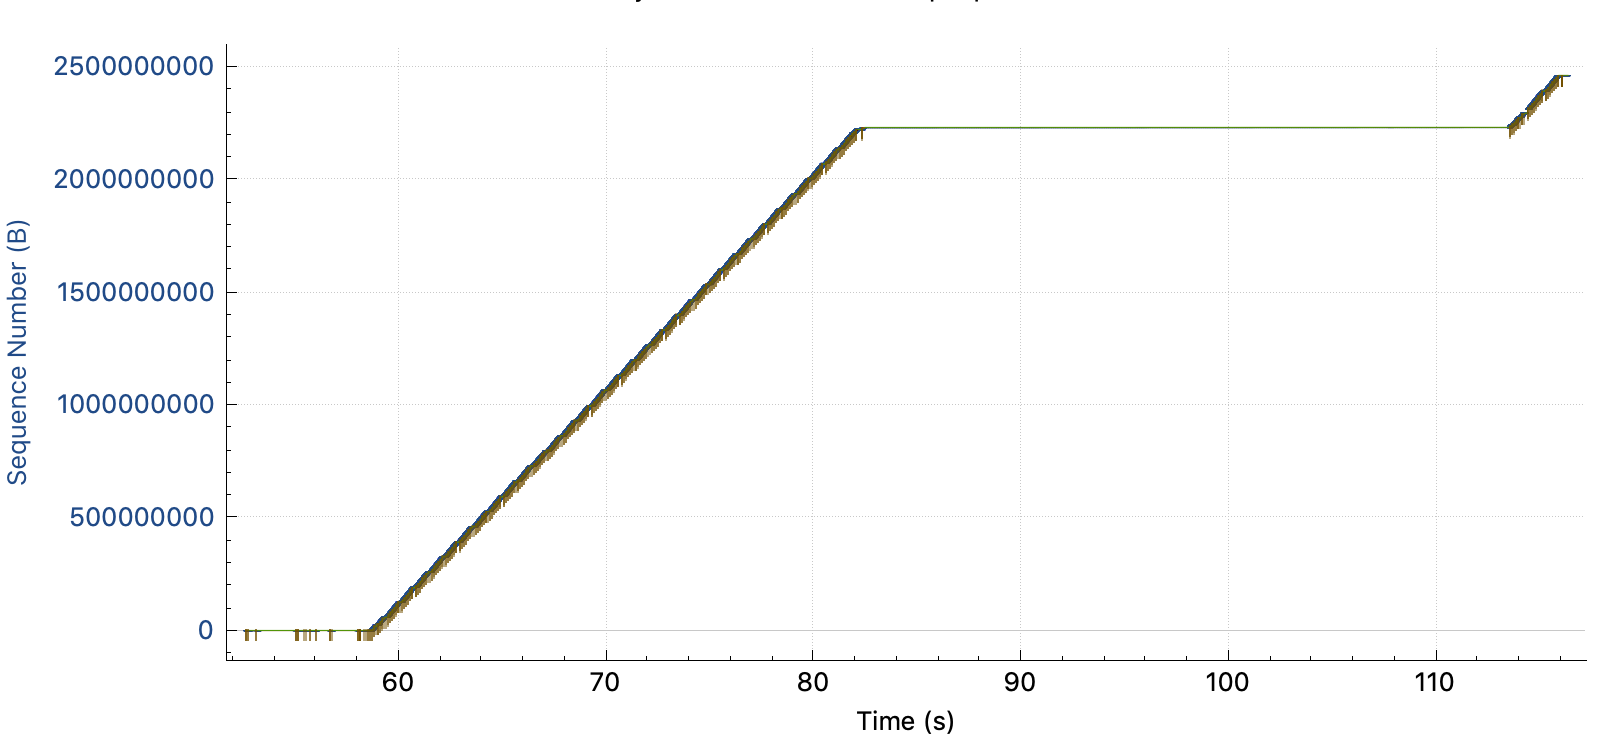
Just before the problem, status is :

  • SACK is working
  • NAS server window size : 1MB (since the begining)
  • Client opens window size at 5MB
  • Windows size is not full (bytes in flight: 725kB)
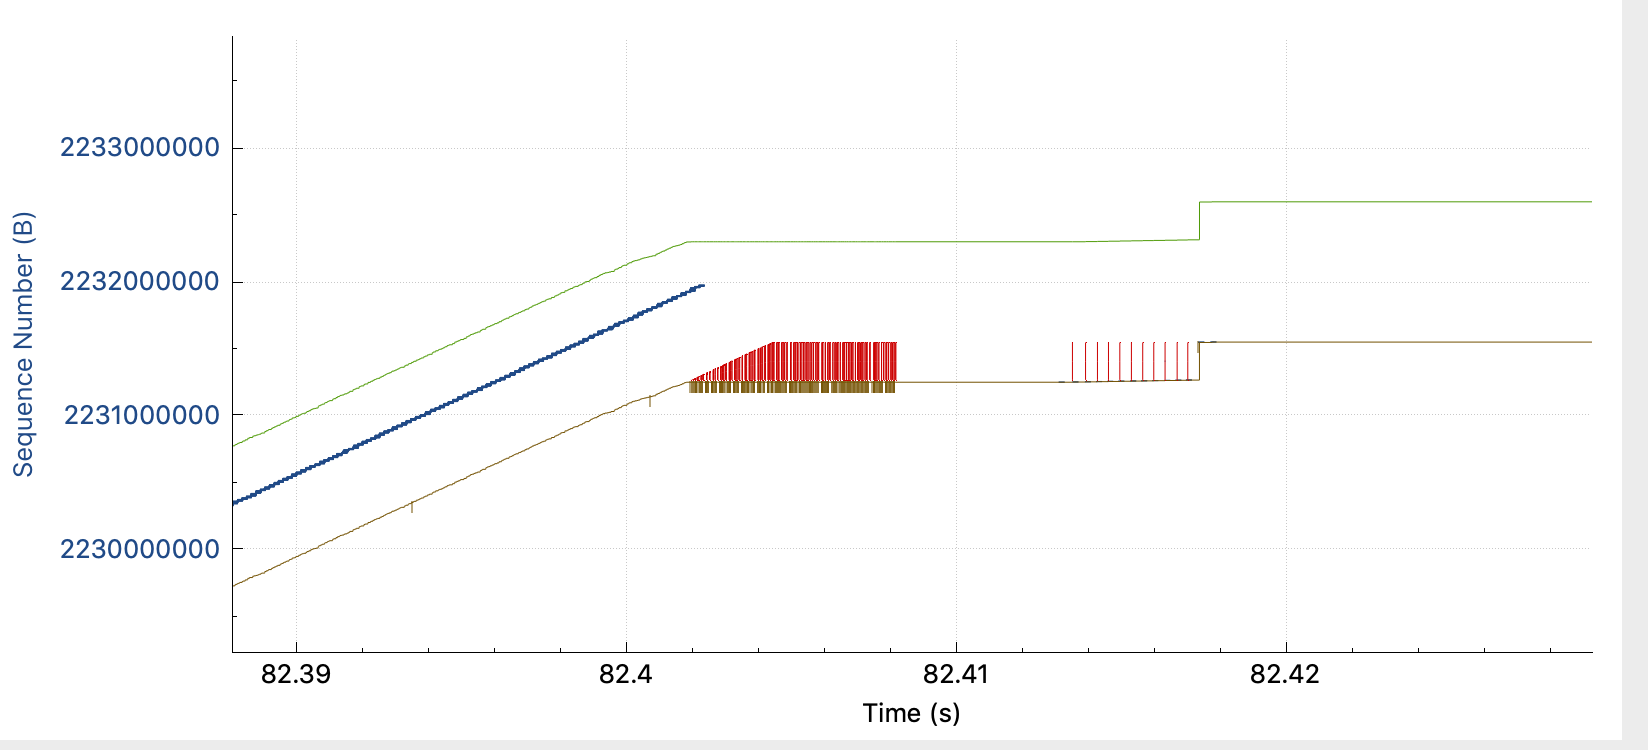
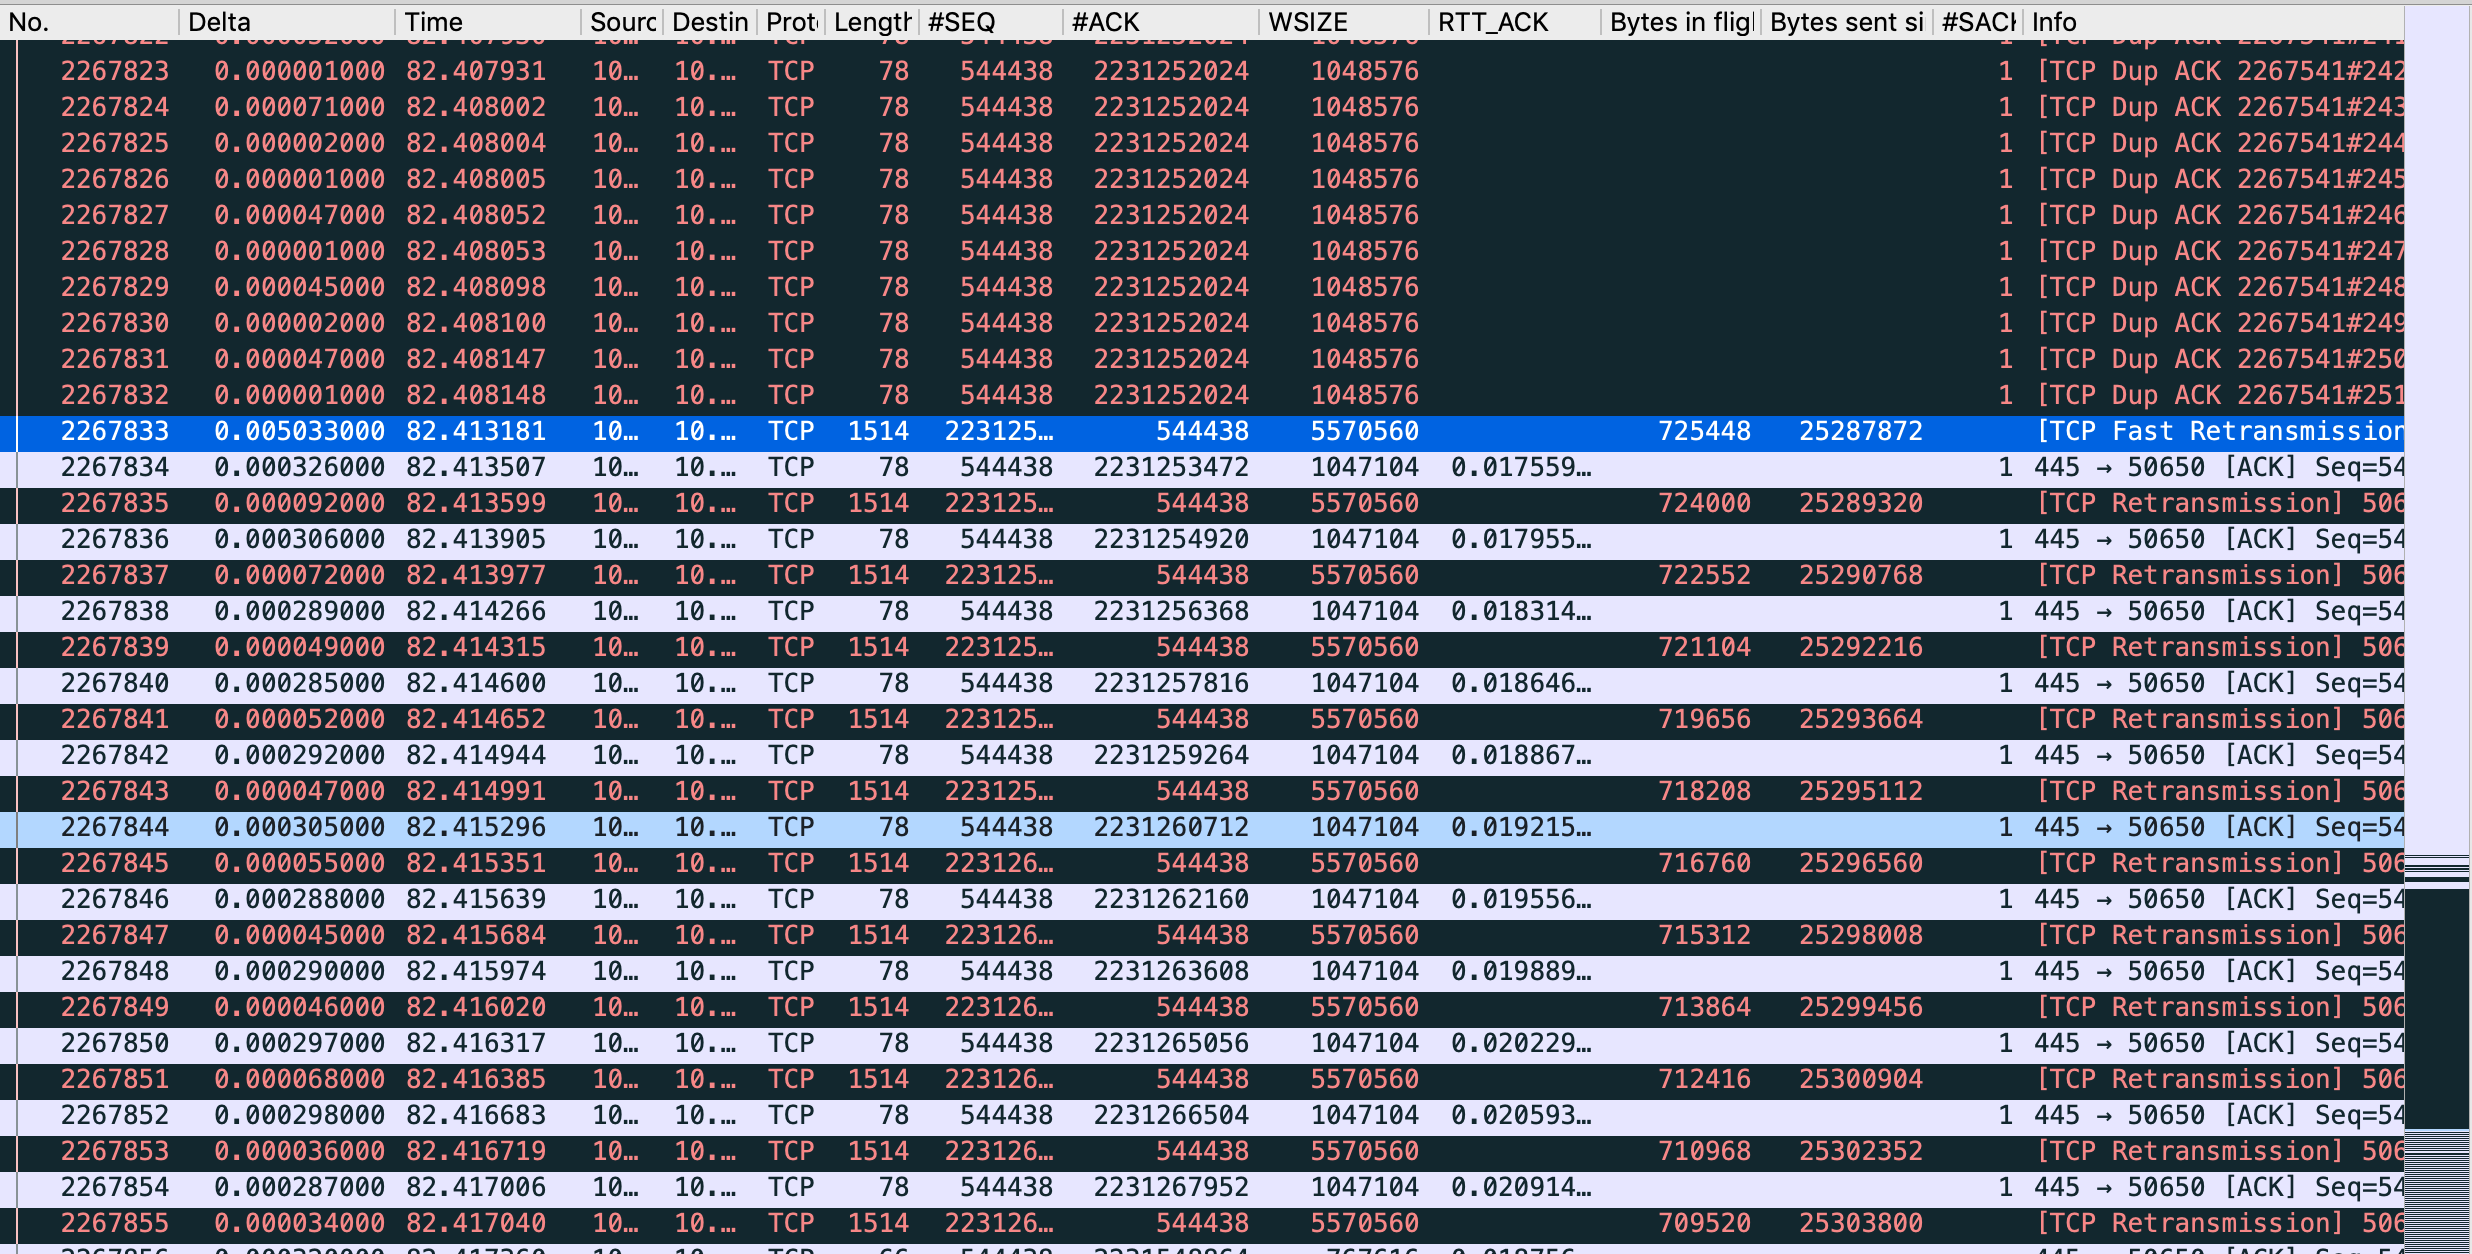
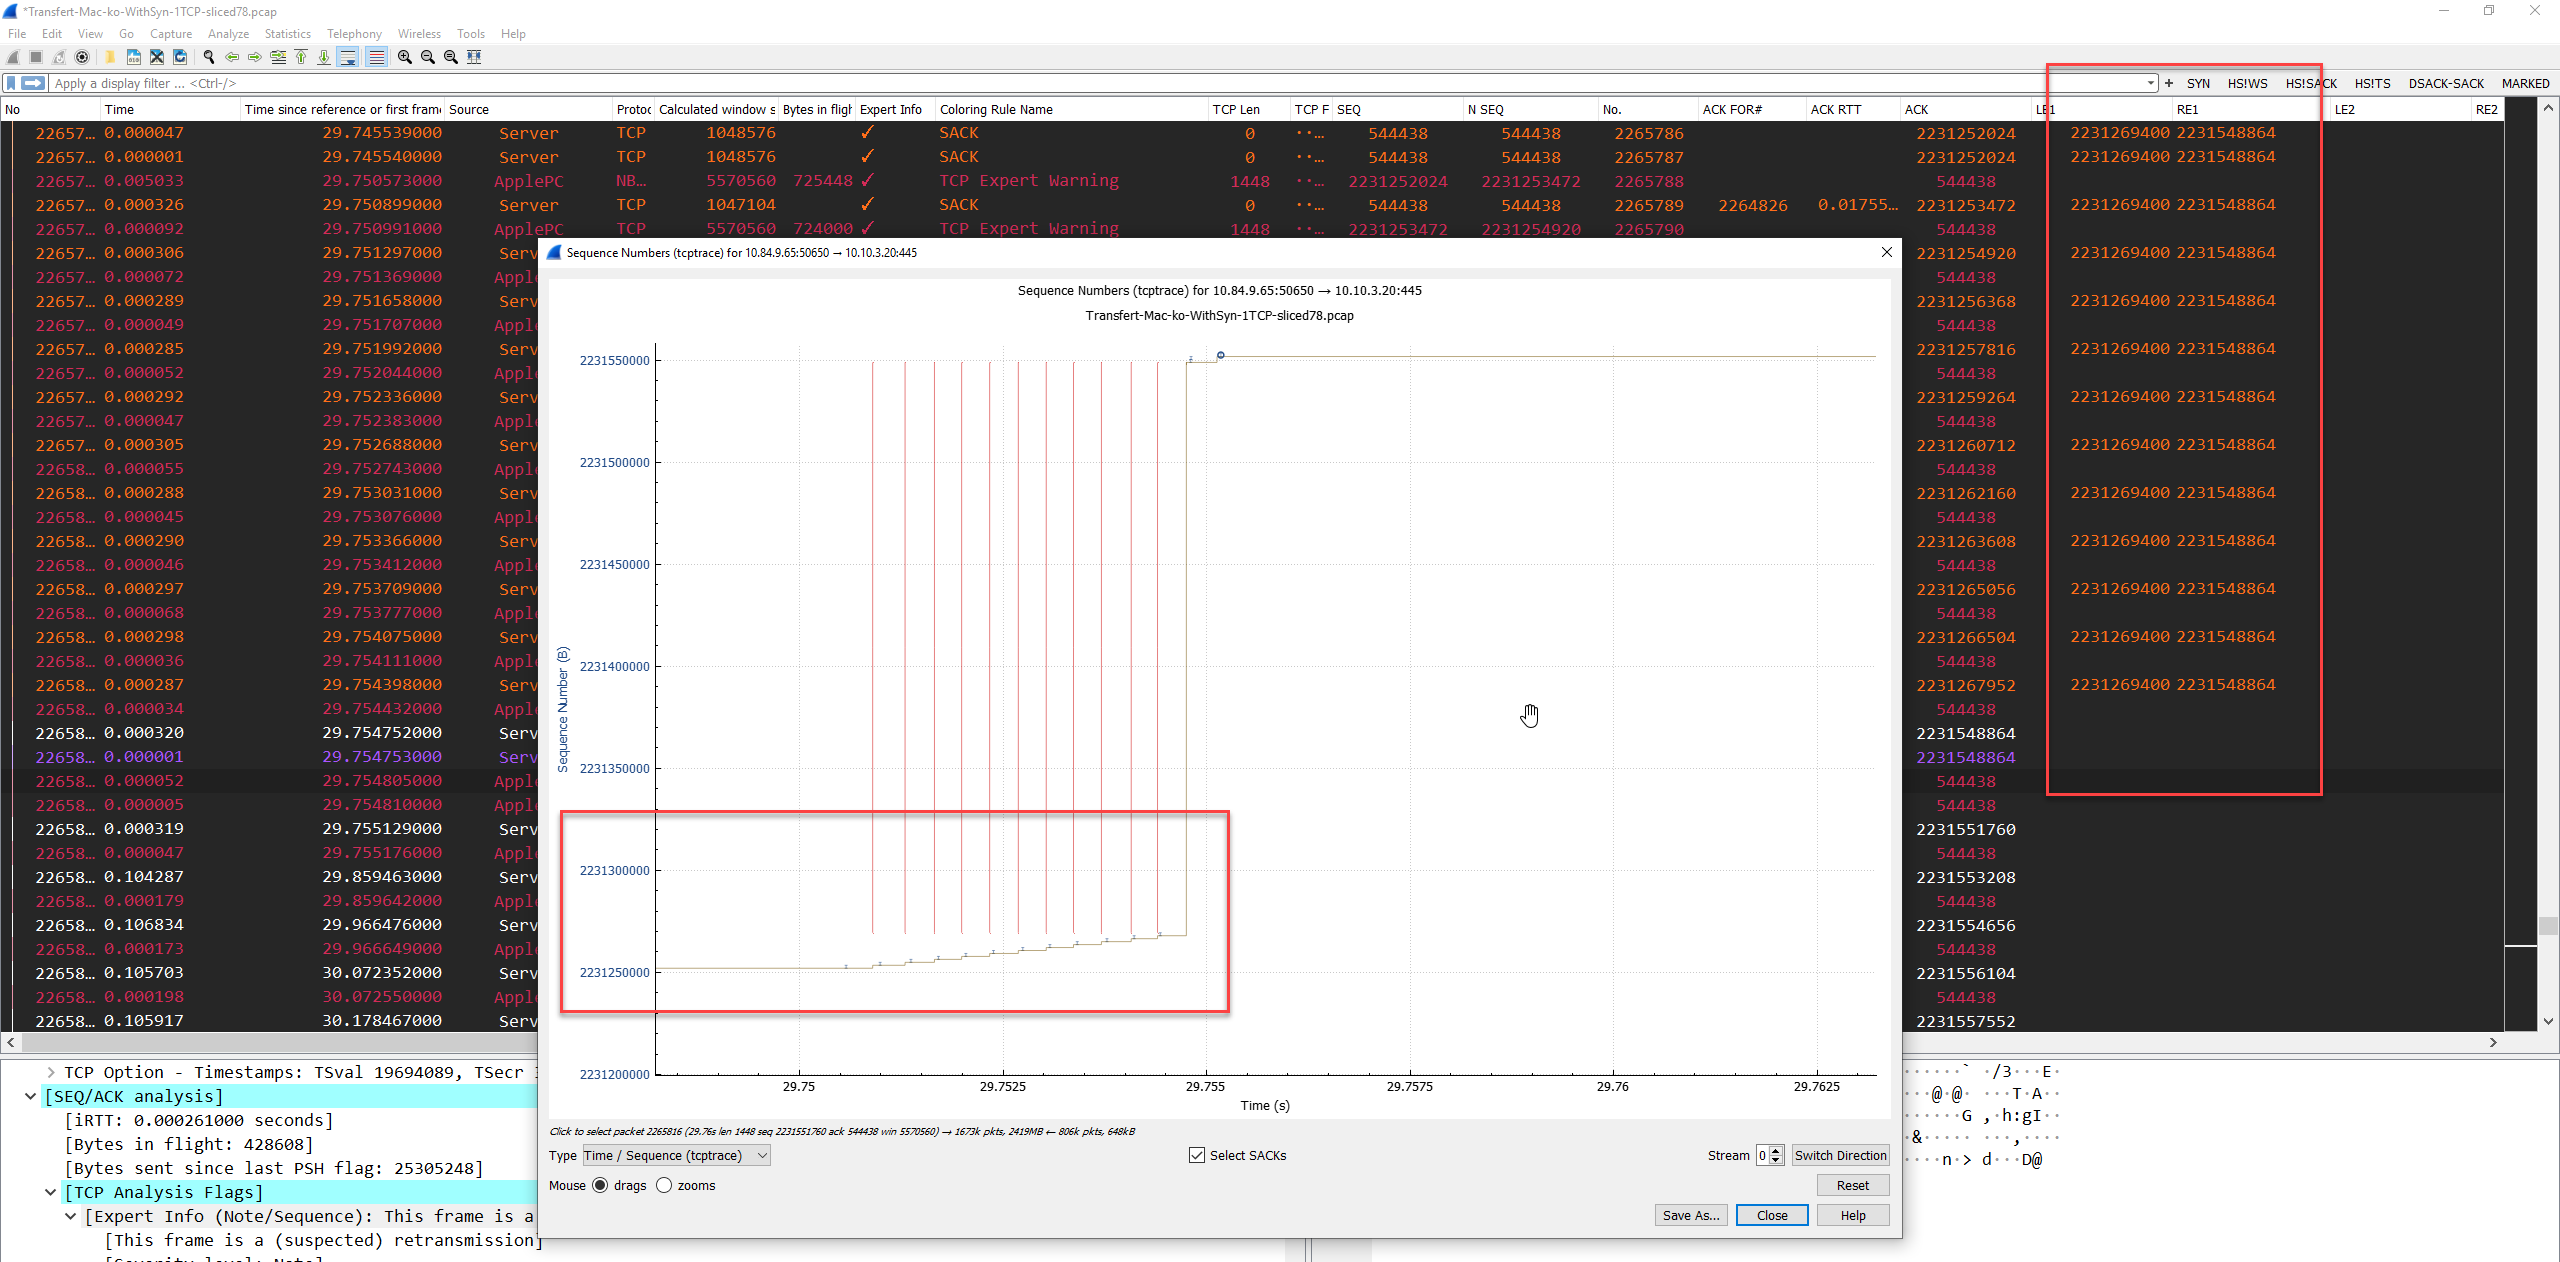
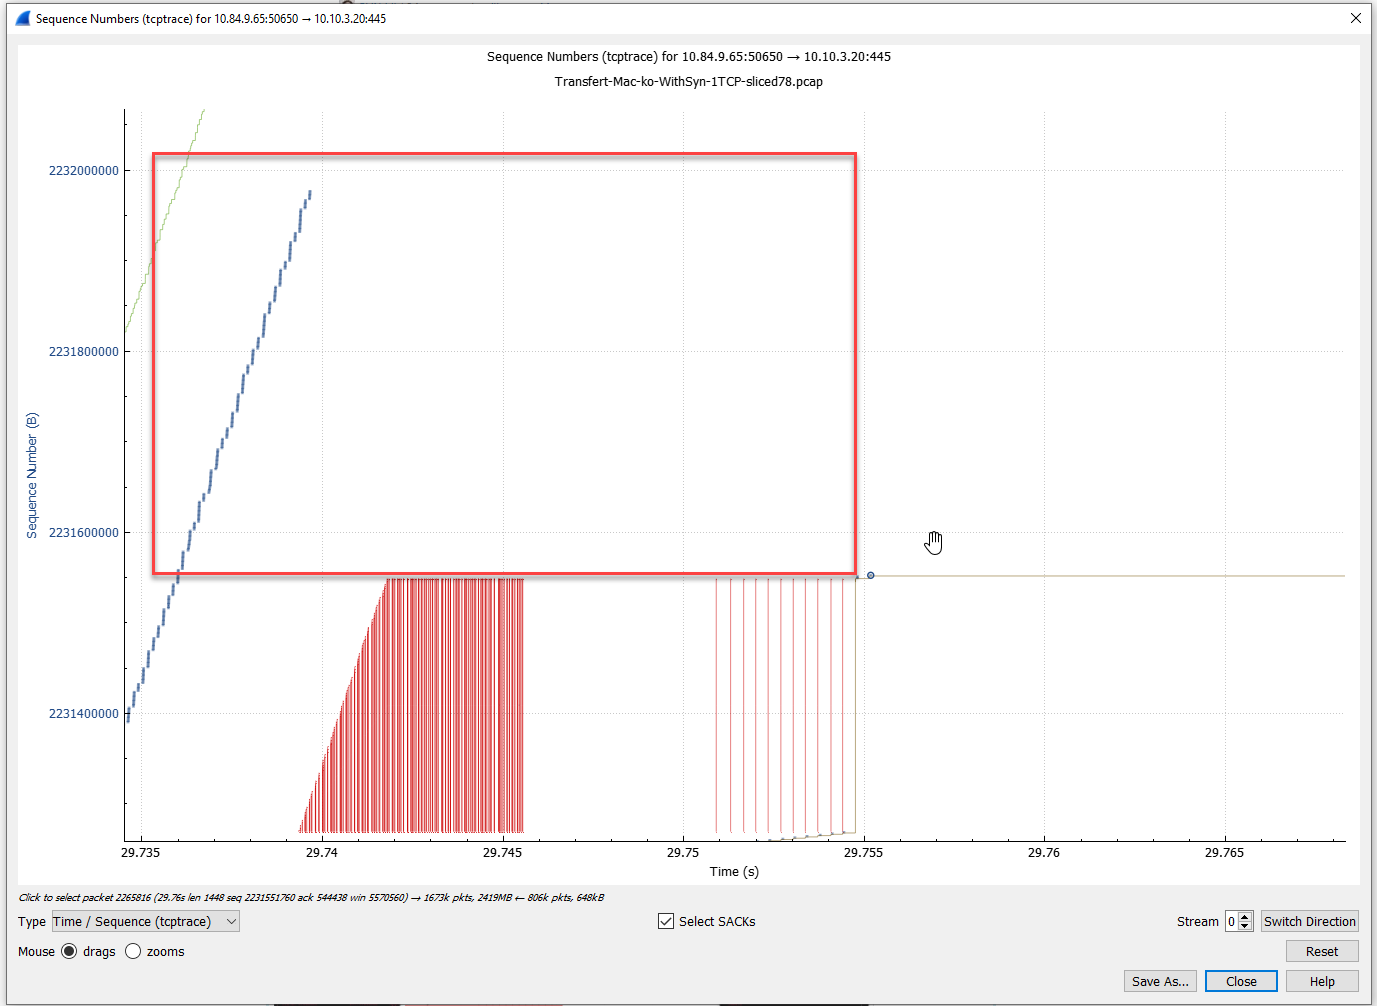
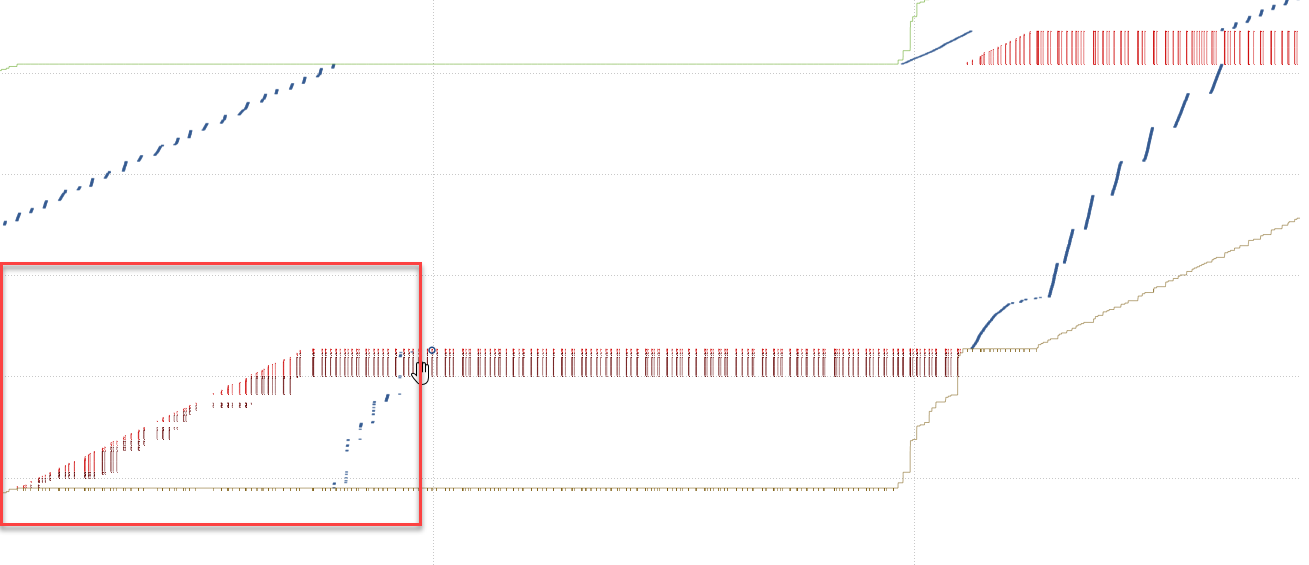
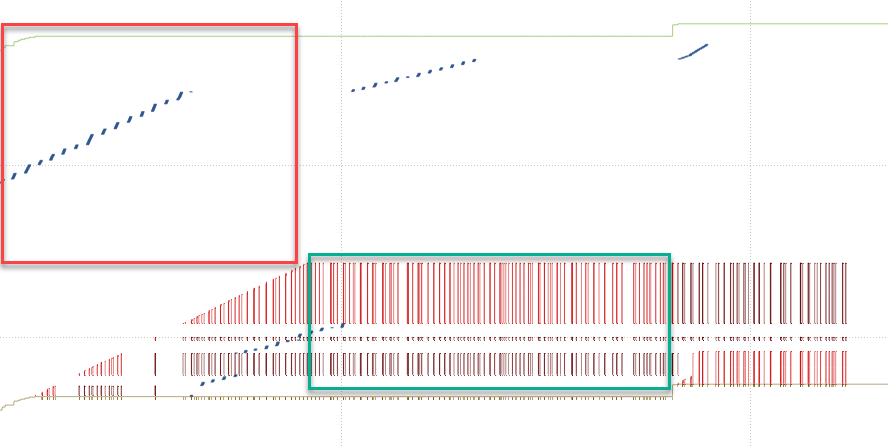
  • At 82.41s, macOS starts to send missing packets 1 by 1. (Before, he's used to retransmit several of them)
  • Server is acking them in iRTT time
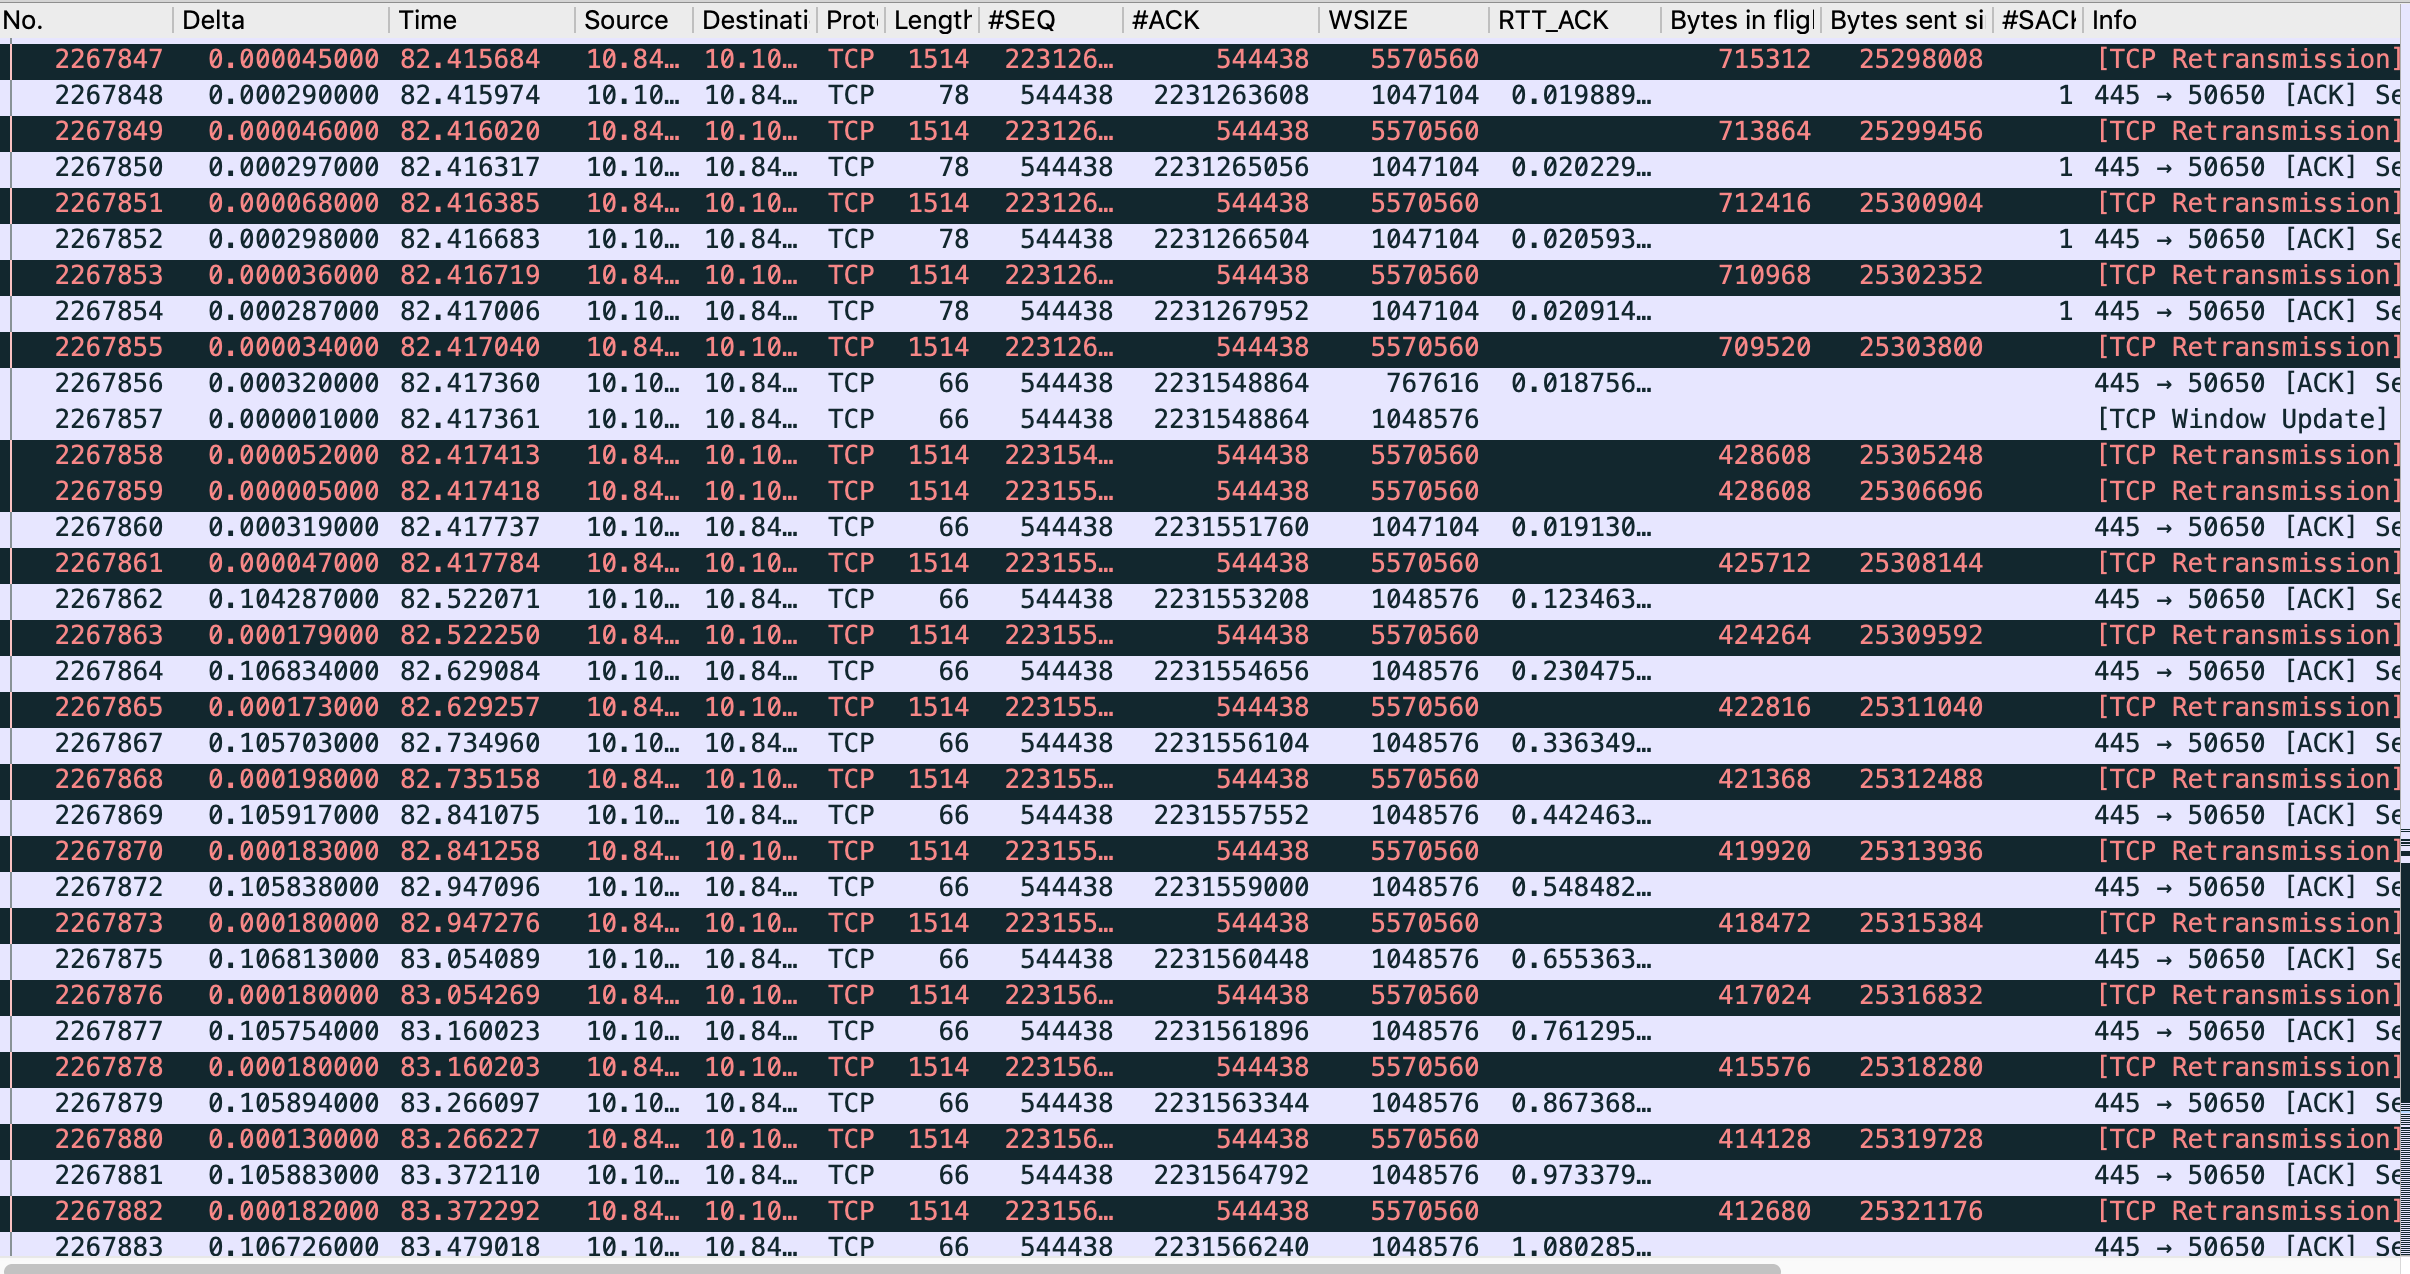
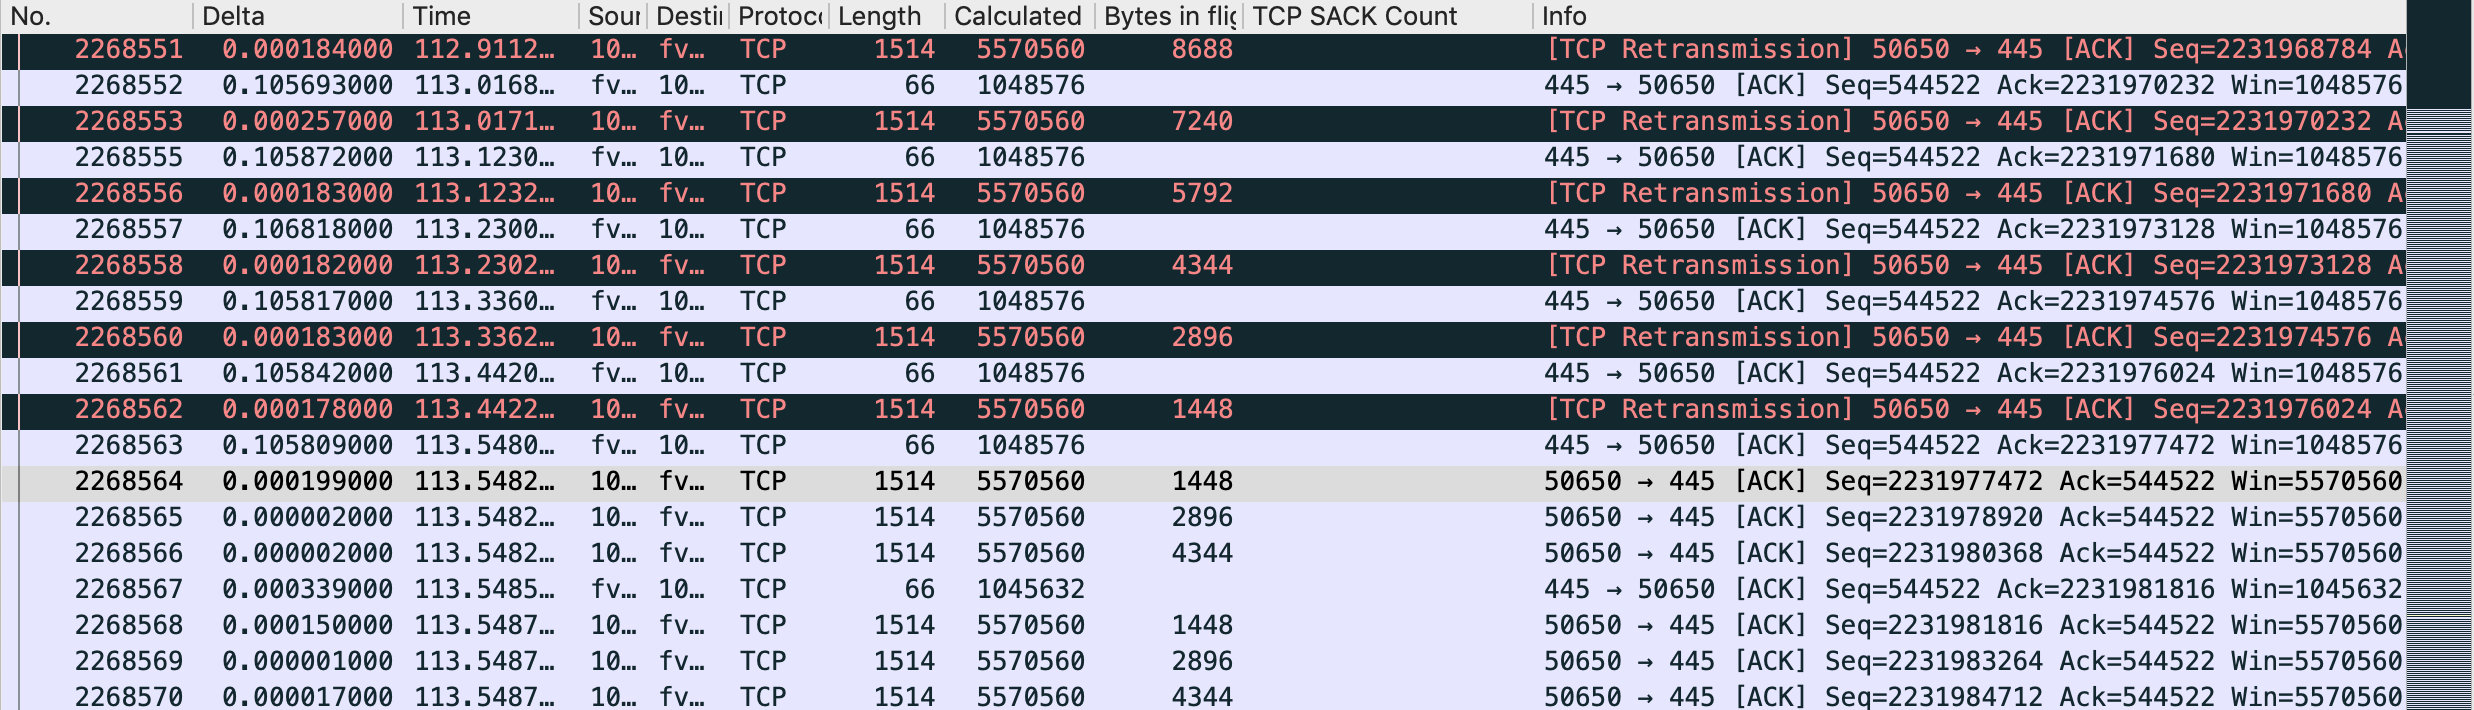
  • At 82.522, after a few 1 by 1 retransmitted packets, acked immediately, it looks like the server is saying this rule : "Now, you gonna pay me every bytes currently in flight, but I impose a static 105ms delay in ACK."
  • Then the long seconds, consists of Retransmit + ACKed in 105ms + Retransmit + ACKed in 105ms ... till all bytes in flight are ACKed.
  • At 113.548, uploads starts again at full speed

My question about :

  • Sending packets 1 by 1 makes sense on server side to reduce congestion window to 1 MSS
  • But the 105ms delay from server before acking -> is it a known "congestion" behavior ? Or kind of slow start ?
  • It looks to a consequence of a behavior of macOS to send packets 1 by 1 (supposition to understand next question)
  • Why would this behavior would happen only on macOS and not Windows clients ? Knowing that same packets losses are experienced by macOS and Windows Clients (and Windows servers)
  • Could it be due to SACK ?

tcptrace_full tcptrace close before the problem First retransmits 1x1 acked quickly Begining of 105ms acks End of retransmit : no more bytes in flight

Screenshots attached in case inside pics are not ok :

edit retag flag offensive close merge delete

Comments

Hi Tom

A wonderful mystery! Could you share a few more details:

  • Any chance to find out the version of Windows is the server running? Like, from the SMB handshake? Or some host announcement?
  • What anti-malware solution is running on the server? Did you rule out AV?
  • Is there a WAN optimizer, policy based routing, software defined network involved?
  • Do we know, if SMB multipathing is active? Would client and server use only one TCP session for the data transfer?
Eddi gravatar imageEddi ( 2021-03-30 19:29:48 +0000 )edit
1

And the most important detail, the (sanitized) pcaps?

SYN-bit gravatar imageSYN-bit ( 2021-03-30 19:34:08 +0000 )edit

@SYN-bit: I fully agree.

@TomLaBaude we need a sanitized pcap!

Christian_R gravatar imageChristian_R ( 2021-03-30 21:39:03 +0000 )edit

Sending packets 1 by 1 makes sense on server side to reduce congestion window to 1 MSS

Could be part of data recovery algorithm...

RFC 2018: 
Chapter 5.1 5.1  Congestion Control Issues:

   ...Further, during recovery the data
   sender limits the number of segments sent in response to each ACK.
   Existing implementations limit the data sender to sending one segment
   during Reno-style fast recovery, or to two segments during slow-start
   [Jacobson88].

But for better guessing I would need a look in the trace file.....

Christian_R gravatar imageChristian_R ( 2021-03-30 22:04:12 +0000 )edit

It would also be interesting, to have a comparable Windows trace. Because my personal feeling, at least in my private network (not proven by a trace) is that MacOS has a higher SMB throughput than Windows.

Christian_R gravatar imageChristian_R ( 2021-03-31 07:06:22 +0000 )edit

4 Answers

Sort by » oldest newest most voted
0

answered 2021-04-06 21:15:56 +0000

Eddi gravatar image

I was privileged to take a look at the trace from an SMB level. Here are a few observations from the trace:

  • In general, the server is somewhat sluggish when responding to write operations. The RTT is 312 microseconds. The service response for write operations is usually 5.x milliseconds
  • The steady pattern of 5.x msec response time is rarely broken by responses as quick as 2 msec and the longest response time 25 seconds. The latter is caused by the famous retransmissions.
  • The client creates the target file with options "read, write, append" on the file server. At the same time, the client permits sharing for read, write, and delete operations. As a result, the server has to prepare for lock management, even if the file is not really shared.
  • The client uploads a file without specifying the size of the target file. As a result, the server has to expand the file on the fly. This opens the road to fragmentation on the file system.
  • The client is not using SMB pipelining. Instead, it sends the next data block only, after the last operation completed.

Unless the transfer is stopped by the packet loss (as analyzed by Sake, Christian and Phil) data is transmitted at approx. 750 MBit/sec. This does not leave a lot of room for improvement for a 1 GBit link.

A few things to check on the server side (if possible, or still necessary)

  • Check, if the variations in response times are related to operations from another client (more Wireshark)
  • Check disk fragmentation
  • Check the hard disk health status
  • Run onboard diagnostics to identify other bottlenecks on the server side (CPU, memory etc.)
  • Check the server's RAID architecture. RAID-5 is probably not the best choice for applications involving lots of write operations.

Thank you Tom, for the interesting case

edit flag offensive delete link more
1

answered 2021-04-05 06:57:18 +0000

updated 2021-04-08 05:39:33 +0000

Edit 2: It's interesting how "sleeping on it" can make things clearer in one's mind.

I now do think that there is a bug in the way the receiver handles SACKs - exactly as @SYN-bit pointed out right from the start.

The count of "Dup-Acks" (which are SACKs here) tells us how many data packets did get through to the receiver. In both traces, there were more SACKs than the SACK maximum RE included in the actual SACK LE/RE fields.

The conclusion is that the device sending the SACKs (bear in mind that it could be some intermediate device such as load balancer - instead of the NAS) reaches some sort of arbitrary SACK data limit and decides to stop adding to the SACK RE values, even though it has received more data.

Looking at the charts included by @Christian_R, those SACKs in the green rectangle should continue to slope upwards - like they do in the red rectangle above it.

The maker of the NAS (or whatever is sending these SACKs) should be encouraged to take a look at their TCP stack with a view to examining the possible bug.

That said, by far the main reason for the "dozens of seconds" delay in the file transfer is the very timid congestion avoidance/loss recovery algorithm used in the Mac. I'd guess that the problem isn't apparent for Windows clients because they now use a more aggressive algorithm such as Cubic.

Although this Mac behaviour is completely valid as far as TCP RFCs go. It would be great if Apple could be convinced to "update" their congestion avoidance algorithm - as Microsoft have done. Even a slight modification to send 2 retransmissions at a time (rather than 1) would improve this situation greatly (because all the 100ms "Delayed Acks" likely wouldn't happen.

Does anyone know if the Apple Mac has an option to modify the congestion avoidance algorithm?

Fixing the SACK bug would also at least reduce the number of delayed ack retransmissions and shave off a large number of the 100ms delays.

Lastly, the whole "slowness" thing is triggered by packet losses. The only "fix" that is actually within your power @TomLaBaude might be to see if you can find where packets are being lost and somehow reduce that (such as adding more buffer space in a router, or implementing shaping in a router that already has more memory).

It is definitely an interesting case study. Thanks to Tom for sharing it.


Original: I don't think there's a bug with SACK behaviour.

It looks like a group of 12 packets got lost after the sniffer saw them – based on the SACKs that tell us that. About 250+ subsequent packets did get through, however, about 400 KB of data packets after that didn’t get through either.

The 12 lost packets (as reported by lots of SACKs) were eventually retransmitted one per RTT and a SACK acknowledges each one. These SACKs come without any delay ... (more)

edit flag offensive delete link more
1

answered 2021-04-02 16:20:47 +0000

updated 2021-06-06 21:29:41 +0000

Update 1: Default Congestion algorythm on MacOS is Cubic:

net.inet.tcp.newreno_sockets: 0
net.inet.tcp.background_sockets: 2
net.inet.tcp.cubic_sockets: 114
net.inet.tcp.use_newreno: 0
net.inet.tcp.cubic_tcp_friendliness: 0
net.inet.tcp.cubic_fast_convergence: 0
net.inet.tcp.cubic_use_minrtt: 0

Update 2:

If someone knows the following bullet points better, please correct me. All sources I have found, stated things sometimes differently so I tried to get it right connected.:

++++++++ can be discussed +++++++++++++++++++++

  • Even Cubic uses the recovery algorithms of New Reno, it divers only in congestion avoidance state.
  • an RTO causes cwnd=1 as long as all outstanding data is recovered
    • cwnd=1 causes the receiver side to go into delayed ACK
  • the difference between the huge gap and the faster recovery times is SACK. A packet which causes a SACK have to send out immediately.
    • but due to the SACK problem on the server side, no SACK blocks can be reported anymore (See Sakes answer or the picture with the green rectangle below)

++++++++++++++++++++++++++++++++++++++++++++++++++

Original post:

Here comes my try of an answer: In the screenshot the followings things can be observed:

  1. The server obviously supports only one SACK block
  2. The client fills the gap correctly.
  3. When the gap is closed the server stops advertising SACK. This is in this case an allowed behaviour, as it was not forbidden to discard packets which can´t be advertised in a SACK block
  4. It can´t be told by evidence what has happened with the already transmited packets. But the server advertises them as lost packets (see second screenshot).
  5. Therefor the client is still in Recovery mode and transmits the packets one by one. And obviously it is like @SYN-bit has pointed out some kind of Delayed ACK comes into play at the server side.

So why is it difefrent to Windows? I have three hypothesis in mind:

  1. Windows sends out the data slower than the MacOS, so that no packet loss or packet Out of Order happens.
  2. Windows does not use TCP-Timnestamping, so that the server advertises more SACK blocks.
  3. Windows uses a different Recovery method

SACK image description

edit flag offensive delete link more

Comments

Well, the server does support multiple SACK-blocks (and has used up to 3 before this issue manifests itself (you can assume this by the high tcp.hdr_len values, Tom cut the file a little too short).

SYN-bit gravatar imageSYN-bit ( 2021-04-03 11:55:19 +0000 )edit

@SYN-bit Thanks for pointing me to that pitfall, as on the client side the tracefoile reports the real packet size, but obviously it does not work for the server packets.

And therefor I was wondering the whole time why I just saw 1 SACK block instead of 3 blocks.

But nevertheless we still don't know what had happened with the data which is going to to be recovered one by one. As the receiver is still allowed to throw away all unacknowledged data, even if it was already advertised in SACK block.

RFC 2018, Chapter 8:

   ...Since the data receiver may later discard data reported in a SACK
   option, the sender MUST NOT discard data before it is acknowledged by
   the Acknowledgment Number field in the TCP header
Christian_R gravatar imageChristian_R ( 2021-04-03 13:23:22 +0000 )edit

Thanks Christian, I learned so many things starting with slicing the trace at the correct amount of bytes, as cutting too short cut TCP options and misled you in the SACK blocks count. I'll consider the timestamps with Windows traces. I wasn't aware that the receiver could discard data already SACKed, but not ACKed ! As Sake pointed out a probable bug in SACK implementation, I'll gather more traces and see how to eventually see directly with Dell/EMC.

TomLaBaude gravatar imageTomLaBaude ( 2021-04-04 17:35:12 +0000 )edit

@TomLaBaude : Thx for sharing the new trace. Here comes my updated observation:

In the first picture SACK works at the beginning, like I would expect. New Segments ariving and the highest blocks are advertised. But then something triggers the same SACK packet again and again (receiving of packets) but obviously they are not put into a new SACK block. expectedSACK

In the second picture I am wondering why the SACK blocks don´t show us any dynamic in the higher segments. Something triggers the same SACK packet (ACK and SACK blocks remain the same) again and again (receiving of packets) but obviously they are not put into a new SACK block. This behaviour of the green rectangle can be seen again in the next screenshot. What has hpened to the transmitted segments? image description

And in the third picture we do see only one SACK block. The advertising of this one SACK is ...(more)

Christian_R gravatar imageChristian_R ( 2021-04-05 16:00:15 +0000 )edit
1

answered 2021-03-31 06:40:57 +0000

SYN-bit gravatar image

My analyis of the JPG's so far is:

  • there is packet-loss, causing SACK block(s)
  • when the first missing packet is received, the ACK jumps about 300k (frame 2267856)
  • then the sender starts sending 1 MSS at a time (I think @Christian_R is right in pointing out the Reno behavior)
  • the receiving side is using a delayed ACK mechanism, waiting for a second packet to do normal ACK
  • since the sender only sends 1 MSS at a time, it times out after 100ms before sending the ACK
  • after receiving the ACK, the sender sends 1 more MSS
  • this process repeats until all gaps in the TCP stream have filled.

But I'd like to see the full SEQ, ACK, SACK etc values (ie see a pcap) to confirm this behavior.

edit flag offensive delete link more

Comments

It took me 20x to understand your line with "delayed ACK mechanism" which is really interesting.

It could be indeed, on receiver side, that at some point it enabled a rule "I'll ACK immediately only 2 MSS minimum, else a 100 ms timer".

Which changes my previous old rule of punishment : "Now, you gonna pay me every bytes currently in flight, but I impose a static 105ms delay in ACK."

-> The receiver can't control if sender will send 1 MSS or more : this could be the difference between Windows and macOS clients! (I won't be able to have a Windows trace before several weeks...)

-> The whole of this makes me think about Nagle's algorithm + Delayed ACK problem.

TomLaBaude gravatar imageTomLaBaude ( 2021-04-01 07:53:22 +0000 )edit

Yup, same steps, different dance. Since there is data to send, it's not nagle holding the sender back. But I guess it's the congestion avoidance mechanism in the TCP implementation on the Mac. Gonna have a look at the capture now :-)

SYN-bit gravatar imageSYN-bit ( 2021-04-01 21:10:01 +0000 )edit

It looks like the SACK implementation of the fileserver is at fault.

From RFC 2018:

   If sent at all, SACK options SHOULD be included in all ACKs which do
   not ACK the highest sequence number in the data receiver's queue.  In
   this situation the network has lost or mis-ordered data, such that
   the receiver holds non-contiguous data in its queue.  RFC 1122,
   Section 4.2.2.21, discusses the reasons for the receiver to send ACKs
   in response to additional segments received in this state.  The
   receiver SHOULD send an ACK for every valid segment that arrives
   containing new data, and each of these "duplicate" ACKs SHOULD bear a
   SACK option.

If you look at the packets with tcp.options.sack_re == 2231548864, you can see that there are multiple packets with the same ACK, SACK_LE and SACK_RE values. These ACK packets must have been triggered by packets from the ...(more)

SYN-bit gravatar imageSYN-bit ( 2021-04-02 06:50:01 +0000 )edit

@SYN-bit Now where we have the full TCP Header available. I think you are right. The server behaviour is strange at least for the packets which have the same ACK, SACK_LE and SACK_RE values, as normally the last change needs to be advertised in the lowest SACK Block.But this does not appear here. Maybe the new packets are easily dropped, due to whatever reason... And those strange packets are more or lesss some kind of "normal" DupACK behaviour. Or it is indeed just a bug. .

Christian_R gravatar imageChristian_R ( 2021-04-05 19:35:42 +0000 )edit

First of all let me say that it was a pleasure to see how you've analyzed this issue. I've a lot of respect for your skills, and I've learned again a lot new about TCP just by following this thread. Great!

I've an additional question about this trace file. There are several pauses in the capture before the packet loss appears. All of them appear after 67.118.840 bytes of send data, and the delay is always something about 110 - 120ms. Just before this happens, the client receives a packet from the server with a TCP payload of 84 bytes (e.g. frame 2169563). I could imagine that it contains something like a pause request from the SMB layer of the NAS, because some kind of buffer is full. Does it makes sense? Any ideas?

JasMan gravatar imageJasMan ( 2021-04-11 13:59:54 +0000 )edit

Your Answer

Please start posting anonymously - your entry will be published after you log in or create a new account.

Add Answer

Question Tools

1 follower

Stats

Asked: 2021-03-30 18:31:37 +0000

Seen: 1,553 times

Last updated: Jun 06 '21