 | 1 | initial version |
Your original "AIX-to-Cloud" capture file is made more difficult to analyse due to the fact that there are a lot of packets that weren't captured. That is, missing from the trace file but were there in real life.
However, the reason for the slow transfer is actually quite basic and common. It is some relatively small packet losses at various times which trigger the TCP "Congestion Avoidance" mechanism/algorithm.
When a sender detects packet loss it is supposed to "halve" its transmit window and then ramp up very slowly.
A halving of bytes-per-round-trip or packets-per-RT results in a halving of throughput. The subsequent "gentle" ramp up (usually by one packet per RT) means that overall throughput suffers severely. When there are multiple packet loss events, a chart of the "Bytes-in-Flight" value forms a sawtooth pattern with fast decreases and slow increases. This is clearly visible, several times, in blue on the Wireshark chart (Statistics - TCP Stream Graphs - Window Scaling).
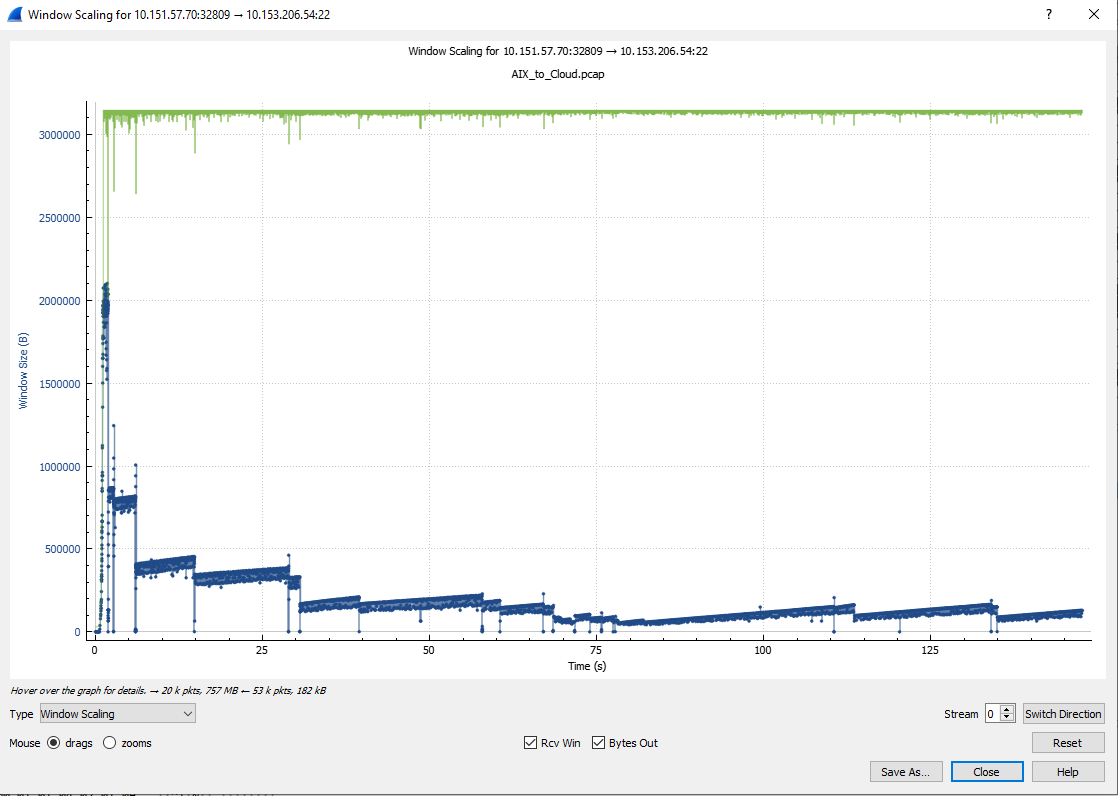
An excellent presentation about Congestion Avoidance algorithms was made by Vladimir Gerasimov at SharkFest 2019 (@Packet_vlad). He did a lot of valuable research and preparation. See Tuesday Class #7 at https://sharkfestus.wireshark.org/sf19. There's a video and a PDF.
In this case you have to find the Selective ACKs - which are shown as "Dup-Acks" in Wireshark. If you delve into the packet detail of the Dup-ACKs, you'll see the "left edge" and "right edge" values that identify them as SACKs. There can be multiple left and right edges, indicating multiple "gaps" in the flow.
You will then see the retransmissions of the data that the SACKs reported as being lost. The retransmitted packets are the correct size in this capture (ie, not the very large ones due to being captured before the IP layer "packetised" them).
The first set of SACKs start at #3458 and the first set of retransmitted packets are #3569, #3570, #3571 & #3572.
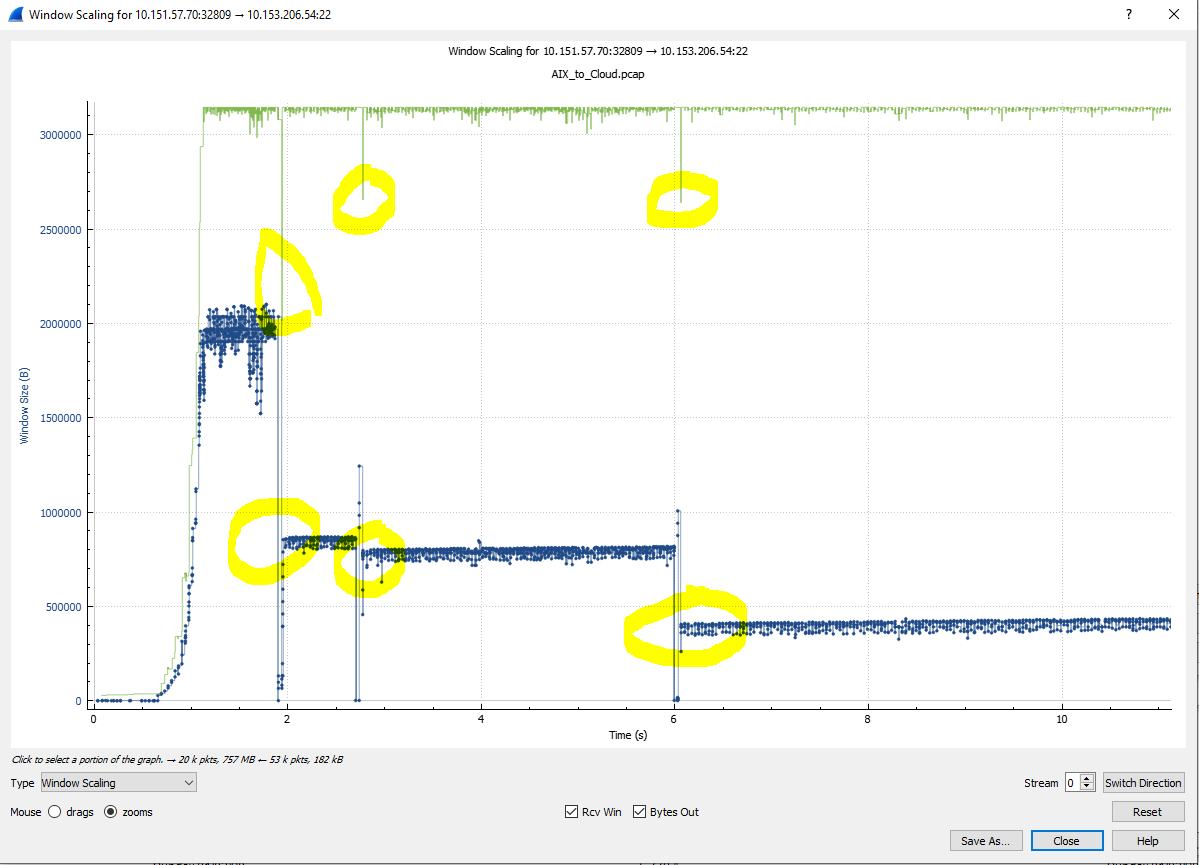
In your case, the sender's transmit window initially ramps up to 2MB (1482 packets x 1400 MSS) per RT. However, the loss of those 4 small packets causes the sender to reduce the transmit window to just 850 KB (620 packets x 1400 bytes) per round trip. The result is that your throughput more than halves at that point.
A short time later, there is another loss event. We see SACK #5040 report that 2776 bytes are missing, #5042 is a retransmission of 1388 bytes. One RTT after that, SACK #5082 reports that #5042 was received and now only 1388 bytes are missing. The sender immediately retransmits that data in #5083.
Interestingly, this packet loss event does not cause a "halving" of the transmit window. Instead, the sender reduces the transmit window to about 780 KB.
The transmit window (proportional to throughput) again gently ramps up around 810 KB until there's another packet loss. SACK #10904 reports two gaps of size 6940 bytes (5 x 1388) and 5552 bytes (4 x 1388). Packet #10906 is an immediate 1388 byte single-packet retransmission.
At the same time, SACK #10905 report a further 2 x 1388 missing bytes - meaning that 11 packets were lost in the last burst. All the lost packets were around the middle of the last 800 KB burst. Thus, the losses don't fit the profile of a buffer over-run somewhere in the network.
One round trip after #10906 we see #10961 to #10970 as a quick burst of 10 x 1388 byte retransmissions. These completely fill-in the three gaps identified by SACKs #10904 and #10905 and everything is back to normal - except that the transmit window is again halved to just under 400 KB per burst.
From an initial throughput of 2 MB per RTT (35 ms), the small packet losses have caused the TCP Congestion Avoidance algorithm to reduce throughput to just 400 per RTT (just 20% of the original throughput).
Sometime later, SACK #19812 reports 1388 bytes missing - which is immediately retransmitted as #19813. This single packet loss causes the sender to again reduce the transmit window to around 320 KB.
The following two charts show the first 11 seconds of the file transfer. In the first one, we see the drops in the blue (essentially a bytes-in-flight calculation) at the times of the packet loss events.
Of interest is that the receiver reduces its receive window (green line) at the same time as the packet loss events. Could this indicate that the losses are due to the receiving Linux server being stressed?
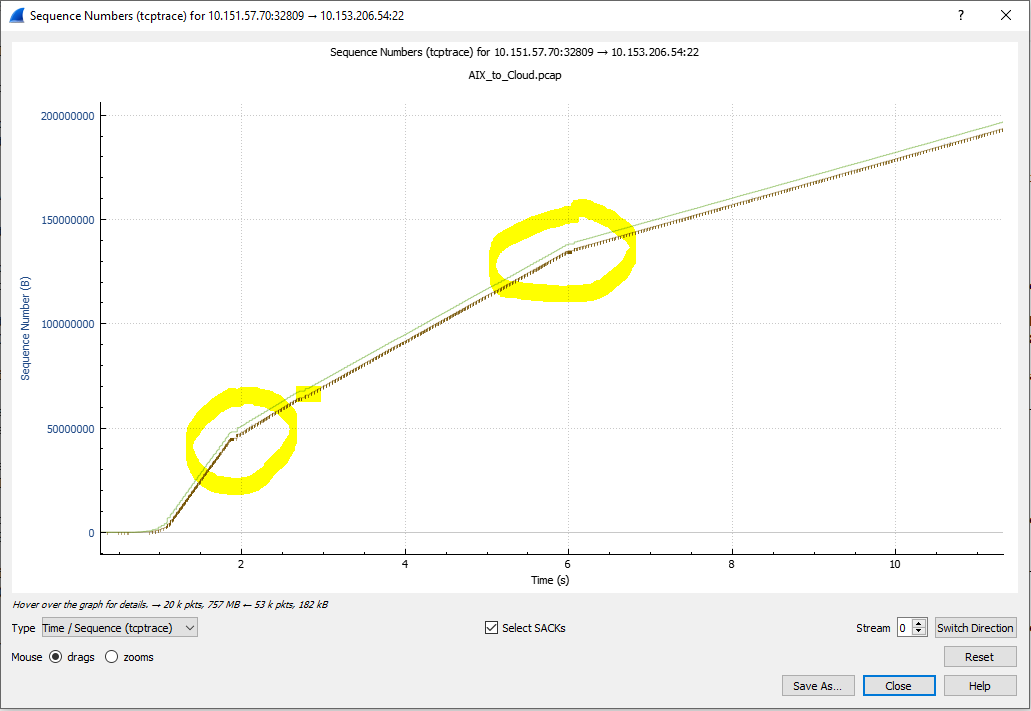
In this TCP Trace chart, we see the "line" of packets beginning with a steep slope (high throughput) and the slope reducing after each packet loss event. If you look at the full timescale of this chart (not included here) you see that the slope reduces many times.
The root cause of your slow throughput is packet loss. You should therefore investigate where this is occurring. The usual suspects would routers where link speed changes (usually a WAN router). However, the receiving server's RWIN reductions might make that the place to start.
Can you get simultaneous sender and receiver captures for a "slow" transfer?
 | 2 | No.2 Revision |
Your original "AIX-to-Cloud" capture file is made more difficult to analyse due to the fact that there are a lot of packets that weren't captured. That is, missing from the trace file but were there in real life.
However, the reason for the slow transfer is actually quite basic and common. It is some relatively small packet losses at various times which trigger the TCP "Congestion Avoidance" mechanism/algorithm.
When a sender detects packet loss it is supposed to "halve" its transmit window and then ramp up very slowly.
A halving of bytes-per-round-trip or packets-per-RT results in a halving of throughput. The subsequent "gentle" ramp up (usually by one packet per RT) means that overall throughput suffers severely. When there are multiple packet loss events, a chart of the "Bytes-in-Flight" value forms a sawtooth pattern with fast decreases and slow increases. This is clearly visible, several times, in blue on the Wireshark chart (Statistics - TCP Stream Graphs - Window Scaling).

An excellent presentation about Congestion Avoidance algorithms was made by Vladimir Gerasimov at SharkFest 2019 (@Packet_vlad). He did a lot of valuable research and preparation. See Tuesday Class #7 at https://sharkfestus.wireshark.org/sf19. There's a video and a PDF.
In this case you have to find the Selective ACKs - which are shown as "Dup-Acks" in Wireshark. If you delve into the packet detail of the Dup-ACKs, you'll see the "left edge" and "right edge" values that identify them as SACKs. There can be multiple left and right edges, indicating multiple "gaps" in the flow.
You will then see the retransmissions of the data that the SACKs reported as being lost. The retransmitted packets are the correct size in this capture (ie, not the very large ones due to being captured before the IP layer "packetised" them).
The first set of SACKs start at #3458 and the first set of retransmitted packets are #3569, #3570, #3571 & #3572.
In your case, the sender's transmit window initially ramps up to 2MB (1482 packets x 1400 MSS) per RT. However, the loss of those 4 small packets causes the sender to reduce the transmit window to just 850 KB (620 packets x 1400 bytes) per round trip. The result is that your throughput more than halves at that point.
A short time later, there is another loss event. We see SACK #5040 report that 2776 bytes are missing, #5042 is a retransmission of 1388 bytes. One RTT after that, SACK #5082 reports that #5042 was received and now only 1388 bytes are missing. The sender immediately retransmits that data in #5083.
Interestingly, this packet loss event does not cause a "halving" of the transmit window. Instead, the sender reduces the transmit window to about 780 KB.
The transmit window (proportional to throughput) again gently ramps up around 810 KB until there's another packet loss. SACK #10904 reports two gaps of size 6940 bytes (5 x 1388) and 5552 bytes (4 x 1388). Packet #10906 is an immediate 1388 byte single-packet retransmission.
At the same time, SACK #10905 report a further 2 x 1388 missing bytes - meaning that 11 packets were lost in the last burst. All the lost packets were around the middle of the last 800 KB burst. Thus, the losses don't fit the profile of a buffer over-run somewhere in the network.
One round trip after #10906 we see #10961 to #10970 as a quick burst of 10 x 1388 byte retransmissions. These completely fill-in the three gaps identified by SACKs #10904 and #10905 and everything is back to normal - except that the transmit window is again halved to just under 400 KB per burst.
From an initial throughput of 2 MB per RTT (35 ms), the small packet losses have caused the TCP Congestion Avoidance algorithm to reduce throughput to just 400 per RTT (just 20% of the original throughput).
Sometime later, SACK #19812 reports 1388 bytes missing - which is immediately retransmitted as #19813. This single packet loss causes the sender to again reduce the transmit window to around 320 KB.
The following two charts show the first 11 seconds of the file transfer. In the first one, we see the drops in the blue (essentially a bytes-in-flight calculation) at the times of the packet loss events.
Of interest is that the receiver reduces its receive window (green line) at the same time as the packet loss events. Could this indicate that the losses are due to the receiving Linux server being stressed?

In this TCP Trace chart, we see the "line" of packets beginning with a steep slope (high throughput) and the slope reducing after each packet loss event. If you look at the full timescale of this chart (not included here) you see that the slope reduces many times.

The root cause of your slow throughput is packet loss. You should therefore investigate where this is occurring. The usual suspects would routers where link speed changes (usually a WAN router). However, the receiving server's RWIN reductions might make that the place to start.
Given that the sending throughput seems to start at 400 Mbps and shrink to 160 Mbps, then 80 Mbps before ending up below 50 Mbps, the router at the sending end of the 50 Mbps link must be buffering large amounts of data. This is also a good place to look for packet losses.
Can you get simultaneous sender and receiver captures for a "slow" transfer?